Posted 7:07 a.m.
The bulls tried for follow-through buying on the open, but the rally lacked consecutive big bull trend bars. It is still unclear if there will be an hour or two rally and then a trading range, or if the 2 hour sideways to down price action has already begin.
The odds of a strong bull trend day are still only 25%, and the most likely thing that will happen is the formation of a trading range that lasts at least a couple of hours.
The Emini is Always In Long, but the rally is weak. It will probably last less than 2 hours and then be followed but at least 2 hours of sideways to down trading. The odds right now are against a strong trend day up or down.
Pre-Open Market Analysis
S&P 500 Emini:
The Emini had a small pullback bull channel after a bull breakout on Friday. It was a Spike and Channel buy climax. There is a 50% chance of follow-through buying in the 1st hour. The Emini is up 3 points in the Globex session after trading in a tight range overnight.
There is also a 75% chance of at least a 2 hour trading range that begins within the 1st 2 hours. If there is no follow-through buying on the open, it can begin on the open. After the trading range, bulls will see a buy setup, like a double bottom or wedge bull flag, and they will try for trend resumption up later in the day. The bears will look at the trading range and see a Major Trend Reversal, and sell, looking for a trend reversal down.
The daily and weekly charts are overbought, and are in the magnetic field of the all-time high of 2,100 from July. There are 3 lower highs in the October to December trading range. The Emini broke above the lower of the 3. It is still in its 2 year trading range. When a market is in a trading range and there is a cluster of resistance levels near the top, the market often goes above some, but not all, and then enters a trading range that can last 20 or more bars. That is probably what will happen here over the next month or two.
If the Emini breaks to a new all-time high, the bulls will want a 300 point measured move up, based on the height of the 2 year trading range. That trading range formed late in a bull trend after an extreme buy climax. That makes it likely that it will be the final bull flag before a reversal on the monthly chart. The minimum goal for the bears is a TBTL Ten Bar Two Leg correction. Ten bars on the monthly chart is about a year. The nearest downside target in the bottom of the range and then the bull trend line around 1700.
The bull channel on the 60 minute chart has been in a stairs pattern since the March 4 high. This means that it has stopped forming gaps. Every new high has been followed by a pullback below the prior high. Bears are scalping shorts at and above new highs, and bulls are beginning to take profits at new highs, rather than buying the breakouts and looking for a new leg up. This is what happens when a channel is transitioning into a trading range. It is also happening at the top of a 2 year trading range, and most trading range breakout attempts fail. This is further evidence that a trading range is likely over the next month or two.
Online day traders will look to swing trade early buying, but if it is not strong, they will expect that a 2 hour trading range or swing down will develop instead. If there is early buying, they will then look for the trading range to begin after a couple of hours. It is possible, but not likely, that today could sell off from the open and totally reverse Friday’s rally. If there is a strong bear breakout, traders will swing trade their shorts.
Since a trading range is likely for a good part of the day, the odds are there will be both a swing up and a swing down. No one knows which will come first, but once it is clear, traders will then look for an opposite swing after 1 – 3 hours.
Forex: Best trading strategies
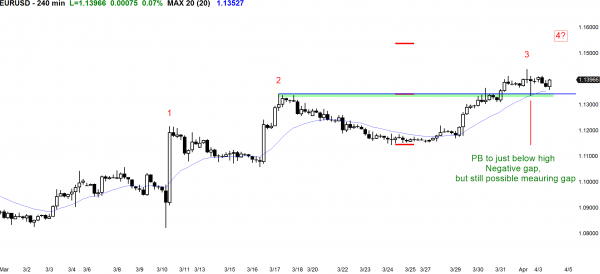
Instead of a gap between the pullback from the breakout and the old high, there was a little overlap. This is a Negative Gap, but it still can lead to a measured move up.
The EURUSD daily chart had a strong 5 day rally last week. The final 3 days had shrinking bodies and growing tails. Today’s body so far is a bear body. This is a sign that the rally is losing momentum. However, there is still room to the October and August lower highs, which are magnets.
The 240 minute chart has been in a strong rally. It tried to top with a Low 2 on March 17, but last week broke strongly above that high. The pullback has overlapped the high, but only a little. This is a sign of a strong bull trend. Although there is a little overlap, the overlap can still lead to a measured move up. The overlap is a Negative Gap, which is almost as strong as an actual gap.
The breakout was strong enough to make a 2nd leg up likely. When the market tries to top, like it did on March 17, but then has a bull breakout, and the breakout is followed by a Low 2 or Wedge top attempt, this 2nd top has a better chance of being followed by at least a TBTL Ten Bar Two leg correction. The correction is on the highest time frame that shows the pattern. That is the 240 minute or maybe the daily chart. This means that if the EURUSD makes another attempt at a top this week, the pattern would be a Low 4 sell setup. It probably will form around a resistance level, like the high and the round number of 1.1500.
The bulls obviously want a breakout above the yearlong trading range and then a measured move back up into the 10 year trading range. It is too early to conclude that this is likely. At the moment, it is unlikely. However, the odds favor at least one more leg up on the 240 minute chart this week, and then another attempt at a top.
The EURUSD has been sideways for 3 days. The 5 minute chart has rallied for the past 2 hours. Since it is still in the 3 day trading range, it might go sideways more. However, since the 240 minute chart has a bull flag, the odds favor at least one more swing up this week.
Summary of today’s S&P Emini futures price action and what to expect tomorrow
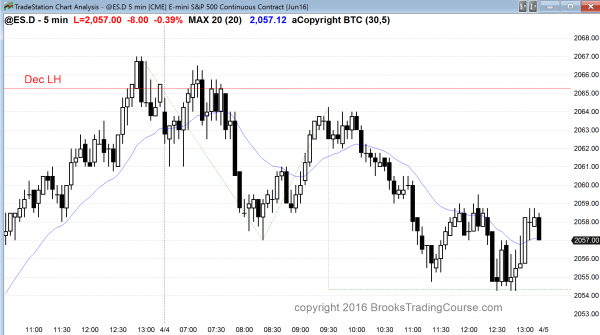
Today was a broad bear channel.
Today was a bear inside day on the daily chart. It is a sell signal bar for a 2nd failed breakout of the high 2 weeks ago. It is also a failure at the December 29 lower high. A trading range is likely for the next month, and the Emini is probing to find the top of the range. Traders will begin to sell reversals down from prior highs. In general, this is a good strategy, especially if the trader can use wide stops and scale in higher.
See the weekly update for a discussion of the price action on the weekly candlestick chart and for what to expect going into next week.
Traders can see the end of the day bar-by-bar price action report by signing up for free at BrooksPriceAction.com. I talk about the detailed S&P Emini futures price action real-time throughout the day in the BrooksPriceAction.com trading room, and a 2 day free trial is available.
When I mention time, it is USA Pacific Standard Time (the Emini day session opens at 6:30 am PST, and closes at 1:15 pm PST). You can read background information on the intraday market reports on the Intraday Market Update page.


