Posted 7:10 a.m.
The Emini continued Friday’s rally on the open, but the rally has now lasted over 60 bars in a relatively tight bull channel. This reduces the chances of a big bull trend day, even though the Emini triggered the Wedge Bull Flag buy when it traded above Friday’s high.
Not only is the rally in a relatively tight bull channel, it is a Low 4 sell setup. There was a 2 legged top yesterday that failed around 10:30 on Friday. There was then a bull breakout that formed a gap. The pullback after 12:30 held above the breakout point’s high. A 2nd leg up after that strong breakout began with the final 5 bars on Friday. The rally continued up on today’s open, and it is the 4th clear leg up from Friday’s low. There were 2 legs up, then a breakout, and finally 2 more legs up and another attempt at a top. The odds are that this rally will evolve into a trading range in the 1st hour or two. Because the leg up from Friday’s final pullback has been in a tight bull channel, the bears will probably need at least a micro double top before day traders become confident that a swing down has begun.
While it’s possible that today could reverse down to below Friday’s low and form an outside down day, that is unlikely at the moment. The bull channel is tight enough to made a trading range more likely than a bear trend. If the downside momentum picks up, bears will be more willing to swing trade their shorts.
Bears will begin selling above bars. Because the bull channel is tight, many bears will wait for 3 or 4 consecutive bears bars before shorting.
The Emini is still Always In Long, and there is no clear top yet. However, because of the Low 4 sell setup, many bulls prefer to buy a pullback instead of at the high. The odds are that this rally will end up as a bull leg in a trading range, but the rally could continue 2 – 3 hours before the bears get their swing down. The odds favor the bears getting a swing down, probably beginning by the end of the 2nd hour.
Pre-Open Market Analysis
S&P 500 Emini: Learn how to trade a minor candlestick pattern buy signal
The daily Emini chart reversed up on Friday after forming a micro wedge bottom over the past 6 days. It is also forming a double bottom with the April 7 and April 12 lows. Friday is a buy signal bar. It had a bull body and it turned up at the 50 day moving average, which increases the probability of a swing up. Today, bulls will buy 1 tick above Friday’s high, expecting at least 2 legs up. Since the wedge is a micro wedge, the 2 legs up might only last a few days.
The bulls have a problem. There is an obvious magnet below at 2026, which is the April low, the bottom of the Final Bull Flag on the daily chart, and only 1 tick below the December 31 low. April is also a signal bar for the bears on the monthly chart. Most traders want to see a break below the April low to find out if there are more buyers or sellers below. All of these things make this support important.
The Emini got close to the support and reversed up on Friday. Friday is a buy signal bar on the daily chart for the 3 week bull flag. However, the selloff from the April high was in a tight bear channel, and that makes the reversal up likely to be minor. When a pullback from a buy climax is in a tight channel, even if it subdivides into multiple legs (here, there is a wedge bull flag), that selloff is usually the 1st leg down in a larger 2 legged pullback. This, along with the 2026 magnet below, make it likely that the 1st rally will be followed by a 2nd big leg down. The 1st leg down lasted 3 weeks. Maybe the bounce will last 2 weeks. Traders will then look for a 2nd leg down below the 2026 level. Markets like symmetry. The 2nd leg down might also last 2 – 3 weeks, and it might fall for a Leg 1 = Leg 2 measured move. Whenever a pullback in a bull trend reverses up from just above support, especially when the channel down is tight, like this one is, the reversal up is usually minor.
A minor reversal usually leads to a trading range, not bull trend resumption. This is especially true in a trading range, and the Emini has been in a trading range since mid-March, and in a broader range for 2 years. In a trading range, a reversal up usually comes after a breakout below support. A reversal down usually comes after a breakout above resistance, like the April 20 failed breakout above the July all-time high. Even though there is a micro wedge bottom on the daily chart and a wedge bottom on the 60 minute chart, the reversal up might not be able to escape the gravitational pull of the support just below. This means that the Emini will probably test below the 2026 support level within the next week or so, especially before testing the April high.
Notice that April was a sell signal bar on the monthly chart and Friday is a buy signal bar on the daily chart. Whenever there is both a reasonable buy signal and sell signal, traders lack conviction and are confused. When there is confusion, traders are quicker to take profits, and the result is usually a trading range.
The Emini will probably trigger the monthly sell signal by falling below April’s low within a week or so. It will also probably trigger a daily chart buy signal by trading above Friday’s high. However, both reversals will probably be minor, and a trading range will begin to become clear on the daily chart over the next couple of weeks.
Even if the rally lasts a couple of weeks, it will then probably form a lower high major trend reversal. Since most major trend reversals do not fall far (only 40% lead to a swing down), the odds are that there will be buyers below the April low, and the trading range will continue to add bars.
The Emini is up about 2 points in the Globex session, and it is slightly above Friday’s high. If it opens here, it will trigger the wedge bull flag buy. If it opens below Friday’s high, it might trade down. However, Friday would still be a buy signal bar tomorrow and probably Wednesday, so the buy does not have to trigger today to be valid.
Forex: Best trading strategies
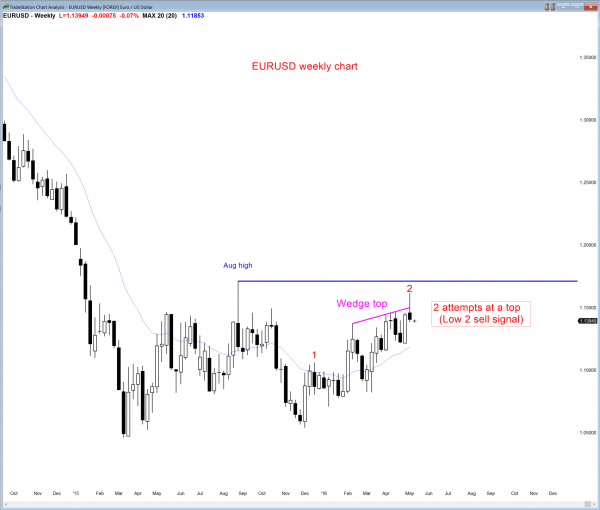
Weekly chart of EURUSD has consecutive tops, which is a Low 2 sell signal. The 2nd top triggered over night when the EURUSD Forex market traded 1 pip below last week’s sell signal bar low.
The weekly chart triggered a sell signal overnight when it traded below Friday’s low. Friday was a reasonable sell signal candlestick pattern within a wedge bear flag. The bears need a big bear candlestick bar this week to increase the chances of a couple of legs down. If instead this week is not a strong sell entry bar, the odds of more sideways to up trading go up. The bulls want a breakout above the August high to trigger a bull breakout of a bear flag. If they get a big breakout, the odds will favor a measured move up.
Right now, the odds favor the bears, and at least a couple of legs sideways to down. Trading ranges are resistant to change. Just as the November selloff failed to break below the bottom of the range, this 5 month rally will probably fail to break strongly above the range. Most likely the trading range will continue to add bars, even though eventually there will be a successful breakout up or down at some point.
The monthly chart of the EURUSD Forex chart reversed up from a double bottom in December. It is now reversing down from a double top at the 20 month moving average. This is a Low 2 sell signal, but it is following a fairly strong rally. That increases the chances that the reversal down will be minor. Most bears will want to see either a micro double top or a strong reversal down before they will be willing to swing trade their short positions.
The EURUSD Forex chart has been mostly in a 30 pip right trading range overnight. Traders are scalping for 10 pips, and many are using limit orders and scaling in. Even thought there are sell signals on the weekly and daily charts, the rally from the March low has had a lot of bull trend bars closing on their highs. This is good buying pressure, and it increases the chances that the Wedge Top on the daily chart might lead to more of a trading range than a test down to the March of December lows.
Also, the Big Up, Big Down candlestick pattern since the April 25 low increases the chances of a trading range for a week or two. There is usually a bounce to a lower high. Then, bears will see a lower high major trend reversal, and the bulls will see a bull flag. The Market usually enters breakout mode where the probability for the bulls and bears getting a breakout and a measured move is about 50% for both.
The odds of a big move over the next week or so are small. Online day traders will tend to scalp until there is a strong breakout in either direction. Again, the bulls want a bull breakout above the yearlong bear flag, and then about a 1200 pip measured move up. The bears want a breakout below, and then a 1200 pip measured move down. There is no evidence that the breakout is about to begin, even thought the context is good for both the bulls and bears. If traders believe a successful breakout is underway, they will be eager to swing trade.
Summary of today’s S&P Emini futures price action and what to expect tomorrow
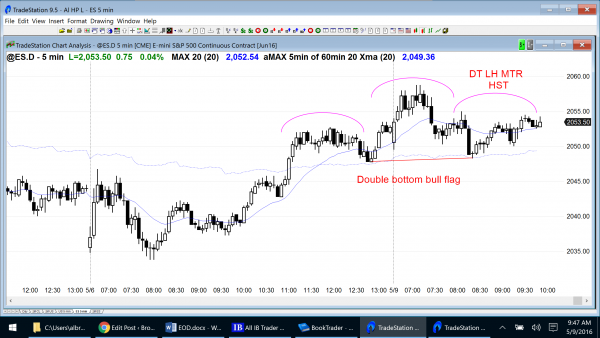
I had to leave early today. When I left, the Emini was deciding whether to finally break strongly above Friday’s high. Friday was a buy signal bar on the daily chart. The 5 minute chart has a double bottom bull flag and a double top lower high major trend reversal (Head and Shoulders Top). It is in breakout mode and the probability is the same for the bulls and bears.
The Emini will probably trade sideways to up for 2 – 3 days after Friday’s 6 day micro wedge bull flag at support. However, the odds still favor a move below the April low, which would trigger a monthly sell signal. As I mentioned, the sell signal is weak, as is the daily buy signal, so the result will probably be a trading range for at least a couple more weeks.
See the weekly update for a discussion of the price action on the weekly candlestick chart and for what to expect going into next week.
Traders can see the end of the day bar-by-bar price action report by signing up for free at BrooksPriceAction.com. I talk about the detailed S&P Emini futures price action real-time throughout the day in the BrooksPriceAction.com trading room, and a 2 day free trial is available.
When I mention time, it is USA Pacific Standard Time (the Emini day session opens at 6:30 am PST, and closes at 1:15 pm PST). You can read background information on the intraday market reports on the Intraday Market Update page.


