Posted 6:53 a.m.
The Emini began with an early selloff after yesterday’s strong rally. Big up, big down so there is big confusion, and confusion is a hallmark of a trading range. The Emini is Always In Short, but it is more likely that the selloff will be a bear leg in a trading range. The tight trading range around 1835 is a magnet and the Emini might have to get there.
While it is possible that this selloff will lead to an opening reversal up or to a big bear trend, it is more likely going to lead to a trading range day. In the absence of a strong move up or down, day traders will mostly look for 2 – 10 point moves up and down.
Pre-Open Market Analysis
S&P 500 Emini: Learn how to trade a bull trend reversal
The Emini reversed up from a parabolic sell climax that fell below the August bear trend low. The bulls see the selloff from the October high as a 2nd leg down from the July all-time high. It is a high 2 (ABC) bull flag on the monthly chart. January was down as much as 10%. That is extremely unusual. With a lot of time left to the month, the odds are that it would be down less. These factors all made a reversal likely this week. I wrote over the weekend and on Monday that the Emini would rally this week, but it might sell off more 1st. The rally has probably begun. Since the selloff has been so climactic on the daily chart, the odds are that the pullback from the selloff will be a sideways to up move lasting TBTL Ten Bars, Two Legs. Since a 2 week trading range is likely, online day traders will look for legs that last 2 – 5 days.
Yesterday had enough momentum so that bulls will look to buy selloffs. It was also a buy climax so bears will sell rallies. There should be good two-sided trading for the next few days, with opportunities for swing trades up and down. The Emini is up about 6 points 30 minutes before the NYSE open.
When there is a buy climax, like yesterday, there is a 50% chance of follow-through buying for the 1st 1 – 2 hours, and a 70% chance of at least a 2 hour trading range that begins within the 1st 2 hours. There is a 25% chance of a strong bull trend day from the open that lasts all day, and a 25% chance of a bear trend day. No matter what happens, there is a 70% chance that a trading range has begun on the 60 minute and daily charts.
Forex: Best trading strategies
The EURUSD 60 minute chart has been in a triangle for several weeks. It had a strong bear breakout below 30 minutes ago. The selloff was big enough so that there are trapped bulls in and trapped bears out. This means that both bulls and bears will look to sell the 1st rally, and that there is a 70% chance of at least one more leg down over the next couple of days.
Day traders who are looking for swing trades will sell rallies. A 50% rally is around the 1.0850 breakout point, but the 1st rally might not get that far. Since the breakout was a sell climax, the EURUSD 5 minute chart might enter a trading range. If so, bull scalpers will look to buy reversals up for 10 – 20 pip scalps, but it will probably be much easier for day traders to make money from the short side for the next couple of days.
Summary of today’s S&P Emini futures price action and what to expect tomorrow
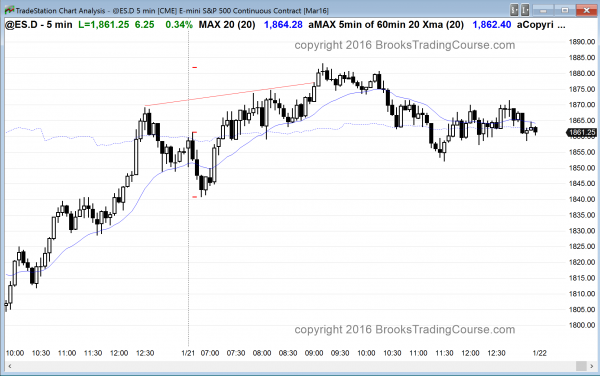
The Emini formed a trading range day after yesterday’s strong bull reversal.
At I mentioned in the 1st 30 minutes, today was likely to continue with its trading range price action, and it did. It is also likely to be in a trading range for the next couple of weeks, which means that the 5 minute chart will also have more trading range price action.
Today was a weak follow-through day after yesterday’s strong bull trend reversal, and the Emini might have to test below today’s low before the buyers return. The odds still favor a 2nd leg up, even if the Emini trades below today’s low.
Less likely, traders will sell below today’s low, betting that tomorrow, Friday, will close below the August low, and that the bear trend has much more to go before there is a pullback.
See the weekly update for a discussion of the price action on the weekly candlestick chart and for what to expect going into next week.
Traders can see the end of the day bar-by-bar price action report by signing up for free at BrooksPriceAction.com. I talk about the detailed S&P Emini futures price action real-time throughout the day in the BrooksPriceAction.com trading room, and a 2 day free trial is available.
When I mention time, it is USA Pacific Standard Time (the Emini day session opens at 6:30 am PST, and closes at 1:15 pm PST). You can read background information on the intraday market reports on the Intraday Market Update page.


