Posted 7:12 a.m.
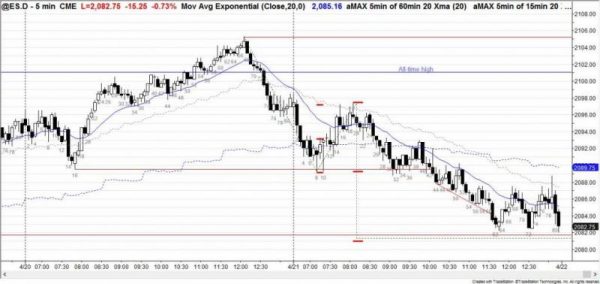
The Emini sold off on the open to the 60 minute moving average. Yesterday was a sell signal bar on the daily chart, and today’s selloff is near the support of yesterday’s low. The selloff has been strong enough for today to trigger the short below yesterday’s low.
However, the selloff is composed of a series of consecutive sell climaxes down to the support of the 60 minute moving average and yesterday’s low. This makes a trading range over the next hour more likely than a continued bear trend. It is also possible for the Emini to form an early low of the day and the rally up to test the July high again.
After consecutive sell climaxes, a trading range is likely. The sell climax was big enough for the Emini to have neutral price action for 2 – 4 hours. This means a trading range is likely. Later in the day, the bulls will look for a higher low, double bottom, or bull breakout for a trend reversal up. The bears will look for a double top and then trend resumption down.
Pre-Open Market Analysis
S&P 500 Emini: Price action favors trading range candlestick pattern today
After 9 months and many attempts, the Emini finally reached a new all-time high yesterday. The cash index did not so there is a divergence. A divergence is a minor problem for the bulls and it is not enough of a reason to get short. The cash index might simply need a couple of more weeks to reach a new high. Whenever there is a new high after a long pullback, the first breakout often pulls back.
This is especially true when the charts are as overbought as the weekly and daily charts are. A pullback is a bull flag, not a reversal into a bear trend. Despite the reversal down from the all-time high, the bears would probably need at least a 10 bar tight trading range on the daily chart before they might be able to create a 5 – 10% correction. Because the daily chart is overbought and the month-long trading range occurred late in a bull trend, there is an increased risk of a Final Bull Flag top. As I said, the bears will probably have to create a transition into a trading range for a couple of weeks before there can be a reversal down.
A reversal can happen at any time. There is only a 25% chance of a clear bear trend developing over the next few days. The reversal down on the 5 minute chart at the end of the day was strong enough so that a 2nd leg sideways to down is likely today. When a market reverses down form significant resistance, like a prior all-time high, bulls usually buy the pullback. The result is usually a test of that resistance.
When the 1st leg was was strong, like yesterday, bulls will be more likely to sell a test back up to the all-time high. They gave up at the end of yesterday, and therefore will be much more likely to scalp out of longs today, at least for the 1st few hours. If yesterday was the start if a pullback or trading range, the initial target is the top of the Final Flag, which is the breakout point around Monday’s low. Monday was also a buy climax bar. The low of a buy climax bar that forms late in a bull trend is a magnet.
If the bears are able to break below Monday’s low, the next bear targets are the moving average, the bottom of the March and April trading range, and a measured move down from yesterday’s high to the Monday buy climax low.
Since the Emini is at an all-time high, bull targets are based on the top of trend channels and on measured moves. It is possible that today could be a huge bull day after yesterday’s pull back, but not likely because the Emini is already overbought. The Emini is up 1 point in the Globex session after a Big Up, Big Down candlestick reversal pattern yesterday. Yesterday was a reversal down on the 15 – 60 minute charts. Again, a 2nd leg down today is likely, and a bear trend on the daily chart is not likely unless the Emini forms a 10 day trading range 1st.
Forex: Best trading strategies
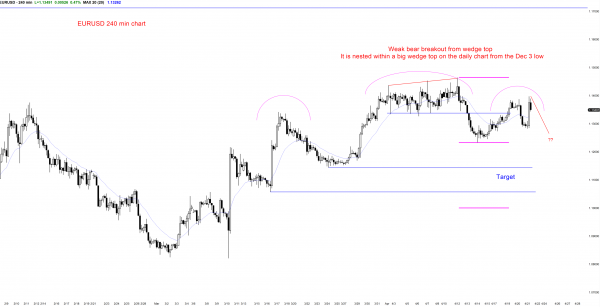
The EURUSD was likely to have a 2nd leg sideways to down after last week’s bear breakout. The daily chart reversed up overnight, and now has consecutive outside bars as the candlestick pattern. This is a common occurrence when a selloff is likely to have 2 legs sideways to down. Yesterday met the minimum target for the bears. Instead of a 2nd leg down that falls below the low of the first leg down from last week, they got a sideways 2nd leg.
Sixty percent of the time when that happens, the reversal up (the overnight rally) fails and becomes a Low 2 sell setup (an ABC bear flag). Forty percent of the time, the bull trend resumption comes without more of a pullback.
The daily chart bears also see the rally of the past 5 days as a head and shoulders top (a lower high major trend reversal). If the EURUSD rallies strongly today or tomorrow, day traders will conclude that the month-long trading range that began on March 18 has been just a pullback in the broad bull channel that began with the December 3 strong bull reversal.
Despite the strong rally over the past 4 hours, the odds favor limited up from here today. A trading range is more likely after a parabolic wedge top on the 5 minute chart that breaks only slightly above yesterday’s lower high. The next couple of days are important. A strong rally would probably be followed by move up to the August top of the yearlong trading range. That high is 1.1712. A strong reversal down below last week’s low would trigger the Head and Shoulders top. If so, there would be a 40% chance of a quick more down to the March 16 low at around 1.1057, and possible to a measured move down to around the March 10 low of 1.0821. Most tops become trading ranges and not bear trends.
Summary of today’s S&P Emini futures price action and what to expect tomorrow
After going sideways for 3 hours, the Emini had a bear breakout and bear channel for the rest of the day.
The Emini triggered a sell signal on the daily chart by going below yesterday’s low. Yesterday was a failed breakout above the July all-time high, and the breakout reversed down yesterday.
While any reversal down from an all-time high can create a new high that can last for years, that is a low probability bet. It is more likely that the Emini will test the July high again within the next week or so. The channel up on the weekly and daily charts is tight. A tight channel usually has to transition into trading range before there is a bear trend. The odds are that the best the bears get over the next couple of weeks is a trading range. In a bull trend, it is a bull flag.
The daily chart has a potential Final Bull flag in early April. The reversal down is an attempt to trigger the sell. The initial target is the bottom of the Final Flag, around 2030. However, the odds still favor a test of the July high before a reversal down begins.
The weekly chart is in an 11 bar bull micro channel. That is unusual, and therefore climactic. There should be a pullback within the next week or two. Remember the Wall Street adage, “Sell in May and go away.” This is because March and April is the most 2 consecutive months of the year, and most of the stock market gains come from October through April. On average, the market is not strong starting in May. I would never place a trade based on a calendar pattern, but enough traders are aware of this one to make it come true, at least somewhat.
Today was a sell climax. There is a 75% chance of at least a 2 hour sideways to up move beginning by the end of the 2nd hour.
Tomorrow is Friday so weekly support and resistance can be important, especially in the final hour or two.
See the weekly update for a discussion of the price action on the weekly candlestick chart and for what to expect going into next week.
Traders can see the end of the day bar-by-bar price action report by signing up for free at BrooksPriceAction.com. I talk about the detailed S&P Emini futures price action real-time throughout the day in the BrooksPriceAction.com trading room, and a 2 day free trial is available.
When I mention time, it is USA Pacific Standard Time (the Emini day session opens at 6:30 am PST, and closes at 1:15 pm PST). You can read background information on the intraday market reports on the Intraday Market Update page.


