Emini wedge top before Congress Trump’s tax reform vote
Updated 6:49 a.m.
The bulls got a breakout to another new high on the open and a Buy The Close open. They want a 4th consecutive bull day. While the Emini is Always In Long, it is at the top of a wedge on the daily chart. Therefore, traders will watch for a reversal down and an early high of the day. The bulls will exit below a strong bear bar or after 3 consecutive bear bars, and the bears will sell.
At the moment, it is more likely that today will be a bull trend day. However, the bars are not big. This makes an early trading range more likely than a big bull day. In addition, traders need to be ready for a possible reversal down from the top of the 3 week bull channel.
Pre-Open market analysis
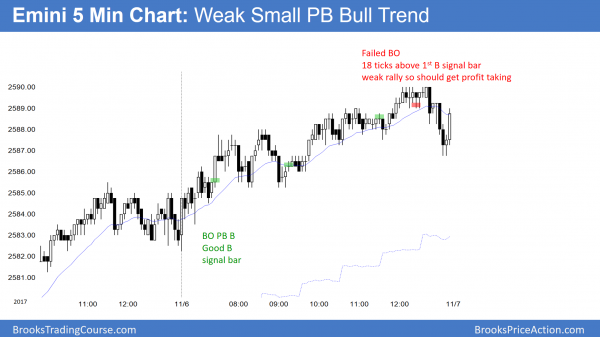
Yesterday broke to a new high, but was a weak small pullback bull trend day. It is a weak sell signal bar for a wedge top on the daily chart. Despite the buy climaxes on the daily, weekly, and monthly charts, the bears need consecutive strong bear days. Without that, the odds favor at least slightly higher prices. However, the odds also favor the start of a 5% pullback to below the August 8 high starting before year-end.
Overnight Emini Globex trading
The Emini is up 1/2 point in the Globex market. The daily chart has rallied 3 days in a small wedge bull channel. The legs up and down have lasted only 2 – 3 days. The bulls want a strong breakout above the wedge top. Yet, they only have a 40% chance of a measured move up. Consequently, the odds favor a 1 – 2 day selloff beginning today or tomorrow.
Since most tops fail, the odds are that this one will as well. Until the bears get consecutive big bear bars, the odds favor at least slightly higher prices.
Yesterday’s setups
Here are several reasonable stop entry setups from yesterday. I sometimes also show limit order entries and entries on the close of bars.
EURUSD Forex market trading strategies
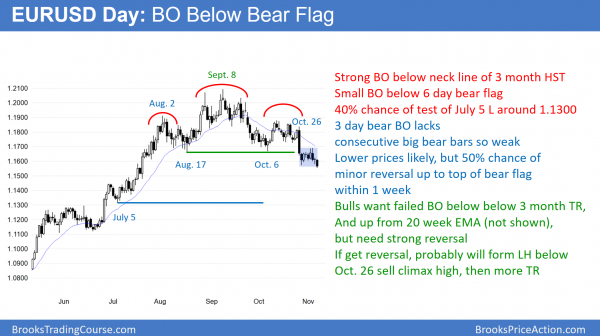
The EURUSD daily Forex chart has traded down for 3 days after a 6 day bear flag. However, the bear trend resumption lacks consecutive big bear bars. Furthermore, it is testing the weekly chart’s 20 week EMA in a strong bull trend (not shown).
The bears are getting their expected breakout below the 6 day bear flag. The 2 day big selloff at the end of October was likely to lead to at least a small 2nd leg down. This 3 day selloff meets the minimum goal.
The weekly chart is in a strong bull trend. This 2 month selloff is the 1st pullback to the 20 week exponential moving average (EMA) in more than 20 weeks. The odds are that the downside over the next few weeks will be small. However, the 2 month bear channel is tight. Therefore, any reversal up will probably lead to a trading range for a month or more.
The daily chart is in a bear trend. The measured move target is about 400 pips down below the 3 month trading range. That corresponds to the July 5 low. Since that is the 1st pullback from a strong bull breakout, it is also support. However, because the weekly chart is so strongly bullish, there is only a 40% chance that the current selloff will get to the 1.1300 area without going sideways first for at least a month.
Overnight EURUSD Forex trading
The 5 minute chart sold off 60 pips overnight, but has been in t 20 pip range for 5 hours. Since the selloff on the weekly chart is a bull flag pullback to support, the odds are against a strong bear breakout below the 6 day bear flag. Instead, there is a 50% chance that the 3 day bear breakout will reverse back up into that bear flag within the next few day.
The 3 day bear breakout has been small and the past 8 days have been small. This is a sign of a lack of selling at these low prices. Bulls will therefore look for a 100 pip reversal up to the top of that 6 day bear flag within the next few days.
The bears need a stronger bear breakout and more bear days to convince traders that this selloff will not stall at the 20 week EMA. While that is possible, it is more likely that the downside from here will not last more than a couple of weeks. The odds are that the weekly chart will begin to enter a small trading range around its 20 week EMA. Consequently, most days will probably be mostly small and sideways.
Summary of today’s S&P Emini futures price action and what to expect tomorrow
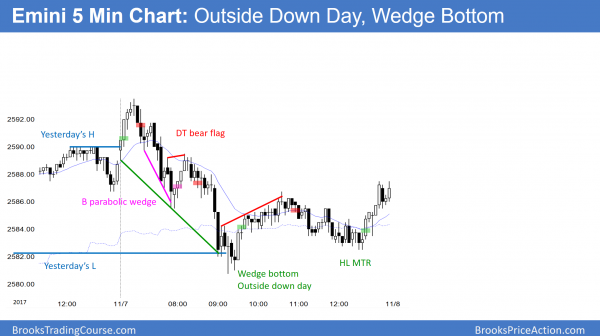
Since today sold off from above yesterday’s high to below its low, today was an outside down day. After a wedge bottom and a higher low major trend reversal, it closed in its middle.
While today was an outside down day, it closed in its middle. This makes it neutral and not a good sell signal bar, despite the wedge top on the daily chart.
The bulls want a break above the wedge and then a measured move up. The bears need a break below the wedge and then a measured move down. If they get it, the correction will test the 20 week EMA.
See the weekly update for a discussion of the price action on the weekly candlestick chart and for what to expect going into next week.
Traders can see the end of the day bar-by-bar price action report by signing up for free at BrooksPriceAction.com. I talk about the detailed S&P Emini futures price action real-time throughout the day in the BrooksPriceAction.com trading room. We offer a 2 day free trial.
When I mention time, it is USA Pacific Standard Time (the Emini day session opens at 6:30 am PST, and closes at 1:15 pm PST). You can read background information on the intraday market reports on the Intraday Market Update page.


