Posted 6:56 a.m.
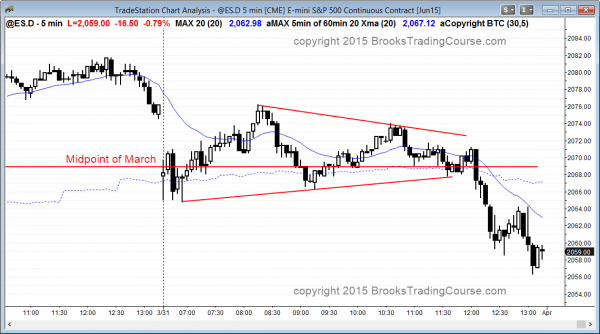
The bulls tried for an opening reversal at the 60 minute moving average and the bears wanted a breakout pull back short below yesterday’s low. Instead, the day began with a limit order market in the middle of the month’s range. Traders learning how to trade the markets need to be patient because they should focus on stop orders. They need a 2nd entry buy near the bottom, or a 2nd entry sell near the top. Otherwise, they should wait for a strong breakout up or down with follow-through to increase the probability of a profitable trade.
This is a breakout mode open in what will probably be mostly a trading range day because it is the last day of the month and it is in the middle of the month’s range. Because today is important for the appearance of the monthly candle, traders should be ready for a big move up or down late in the day. Although unlikely, this is an environment when that can happen.
At the moment, the market is always in short, but it is at support. When there is a limit order market at support, it usually rallies so the odds favor a test up soon, but this is an early trading range.
My thoughts before the open: Monthly sell signal bar
Today is the last day of the month and March is a sell signal bar on the monthly chart. Today will determine whether that bar will close in the middle with a big tail on the bottom, creating a weak sell signal, or with a close near the low of the bar, creating a higher probability signal.
The monthly chart is extremely overbought and there is a 60% chance of a test down to the monthly moving average this year. This is the second consecutive ioi breakout mode setup. February triggered a sell signal by going below the January sell signal bar in the ioi, but February then rallied to above the January high.
An ioi is a breakout mode setup. Bears will look to sell below its low. This means monthly bears will sell in April if April falls below March’s low. Monthly bulls will buy above March’s high. Since the probability of a pullback on the monthly chart is high, if there is a bull breakout, it will probably fail and lead to a test of the monthly moving average. If instead the monthly sell signal triggers in April and the market does not reverse up as it did in February. the target for the bears is any support level below. The monthly moving average is the obvious one that I have mentioned for many months.
Yesterday’s rally failed at the December high and in the middle of lasts week’s selloff. This created a triangle on the 60 minute chart, which is a breakout mode setup, just like the monthly ioi. Since today is the last day of the month, the bulls and bears will try to influence the appearance of the monthly candle. The Emini is currently far from the high and low of the month. The odds are that the month will close somewhere in the middle. This is trading range behavior and it increases the chances that today will be a trading range day. The bears see today as the entry into a low 2 short.
The bulls hope that the gap down does not lead to a fall below Friday’s higher low of 2042 because they want the three day rally to be a bull channel that breaks above the all-time high at some point over the next few weeks. Even if they are successful, the odds are that there will be sellers above and that the market will work down to the monthly moving average over the next many months.
Summary of today’s price action and what to expect tomorrow
Today is the final day of the month and the Emini spent most of the day in a triangle around the midpoint of the month, and then had a late bear breakout.
Today completed the March monthly candle. It is an ioi sell signal in a buy climax, but the channel up is tight. The tail on the bottom of the bar means that it is a weak signal bar. If April trades below the March low, it will be a sell signal on the monthly chart. When the context is bad (here, a tight channel) and the signal bar is weak, the probability of a swing down is less. It is still a sell signal, but it is low probability. The probability is higher for traders swing trading on the monthly chart if they wait to see a strong bear breakout.
The daily chart is at the apex of a 2 month triangle. There is a 50% chance of a profitable breakout up or down, and a 50% chance that the breakout will reverse. The 5 minute chart has been sideways for 4 days after a strong selloff, and the odds are that it will continue sideways until there is a strong breakout up or down.
See the weekly update for a discussion of the weekly chart and for what to expect going into next week.
Traders can see the end of the day bar-by-bar price action report by signing up for free at BrooksPriceAction.com. I talk about the detailed Emini price action real-time throughout the day in the BrooksPriceAction.com trading room, and a 2 day free trial is available.
When I mention time, it is USA Pacific Standard Time (the Emini day session opens at 6:30 am PST, and closes at 1:15 pm PST). You can read background information on the intraday market reports on the Intraday Market Update page.


