Emini testing August high breakout point but possible 5% correction
Updated 6:45 a.m.
The Emini had follow-through buying on the open. Yesterday was a buy signal bar. By breaking above its high, the bulls therefore triggered the buy signal. Yet, since yesterday was a doji, it is a weak signal bar. In addition, today’s entry is at the top of a 10 day tight trading range. Finally, the rally from yesterday’s higher low lacked consecutive big bull bars. Although the bull channel was tight, the bull bars were small and were followed by dojis and bear bars. This is more typical of a bull leg in a trading range.
Since the rally was weak and the daily chart is at the top of a tight trading range, the odds are against a strong bull trend from the open. However, the reversal up was strong enough so that the bulls have a chance at a 1 hour rally on the open. If they get it, the odds then favor a trading range.
The 20 bar channel from yesterday’s higher low was tight. Hence, the bears will probably need at least a micro double top before they can create a swing down. Consequently, the odds are against an early bear trend without 1st forming a trading range. Therefore, a continuation of the trading range price action of the past 10 days is most likely.
Since the swings of the past 2 days have been big, today will probably have at least one swing up and down. Furthermore, each will probably last 2 – 3 hours. The Emini will probably form an early range before it decides on the 1st direction. Again, the odds are against a strong trend day.
Pre-Open market analysis
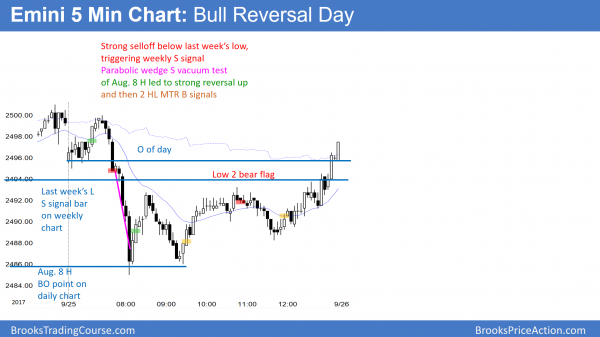
The Emini sold off strongly yesterday and traded below last week’s low. That therefore triggered a sell signal on the weekly chart. Although it rallied back above the low, if it breaks strongly below again later this week, that be a 2nd entry sell signal. Consequently, it would have a higher probability of leading to lower prices. Yet, the bears need a strong breakout, and they have to prevent a reversal back up.
In addition, the sell climax dipped below the August 8 high and reversed up strongly. It tested it two more times and reversed up both times. Therefore yesterday’s strong selloff was a sell vacuum test of the August 8 high breakout point.
However, since the monthly chart is so overbought, the odds of much higher prices without a 1 – 3 bar (month) pullback are small. However, instead of going down, the Emini could go sideways for a few months and then continue higher. Since the buy climax is so extreme, the Emini is more likely to pull back at least 100 points within a few months.
Overnight Emini Globex trading
The Emini is up 1 point in the Globex session. Since yesterday’s reversal up from the August high was strong, the odds favor an attempt at follow-through buying today. Yet the daily chart has been in a tight range for 10 days. Therefore the odds are against a strong bull trend day today. More likely, it will be like most of the past 10 days and have a lot of trading range trading. Yesterday’s reversal up from 3 tests of the August high was strong enough to make a bear trend day unlikely.
Yesterday’s setups
Here are several reasonable stop entry setups from yesterday. I sometimes also show limit order entries and entries on the close of bars.
EURUSD Forex market trading strategies
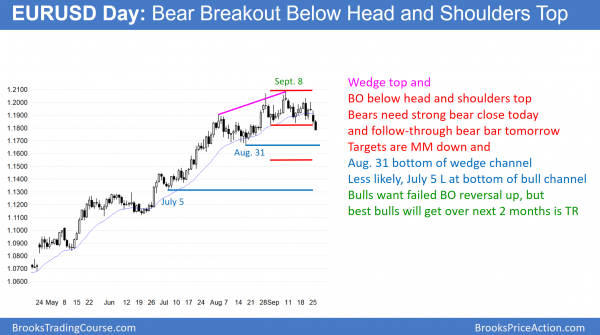
The EURUSD daily Forex chart had a wedge top after a buy climax at resistance. Its 2nd leg down is breaking below the neck line of a head and shoulders top. The 1st target is a measured move down to below the beginning of the wedge. The bulls want the bear breakout to reverse up today or tomorrow, but the best they will probably get is a trading range over the next 2 months.
The EURUSD daily Forex chart had a wedge top. The rally was climactic and it tested the bottom of a 10 year trading range on the monthly. As was likely, it is now pulling back. Because the rally was so strong on the monthly chart, the current selloff will probably be minor on that chart. This means that it will probably last 2 – 3 months and become a bull flag. The bears will probably need at least a micro double top on the monthly chart before they can reverse the bull trend.
When there is a wedge top reversal, the market usually has at least 2 legs down to the beginning of the wedge. That target is the August 17 low. Furthermore, the 2nd leg down is from a lower high. As a result, the wedge top usually becomes a head and shoulders top and a lower high major trend reversal. That is what happened here.
Targets for the bears
The bears need more than a strong break below the neck line, which is the bottom of the 4 week trading range. They need strong follow-through selling within 2 days. If they get it, the odds go up that they will reach their minimum target below. On the other hand, if the bear breakout is followed by a bull bar within a day or two, it increases the chances that the breakout will fail. The bull would then try to get a reversal back up. Yet, even if the bulls get a breakout above the September 8 high, that breakout would probably fail. Hence, the best the bulls will probably get over the next 2 months is a trading range.
Yet, the rally on the weekly and monthly charts is strong. Consequently, while the selloff can be a bear trend on the daily chart, it will probably only be a bear leg in a trading range on the weekly and monthly charts. The EURUSD market is now simply deciding on the bottom of the range. Most likely, it will be just below the August 17 low. If so, the range will be about 400 pips tall. Less likely, it could extend down to the bottom of the pullback after the June 27 bull breakout. That July 5 low is about 700 pips below the September 8 high. If the bear reach that target, the trading range will probably last 3 – 6 months.
Overnight EURUSD Forex trading
The 5 minute chart sold off 80 pips overnight. Yet the selloff was in a spike and wedge channel bear trend. Since this is a sell climax, the odds are against much lower prices today. The top of the wedge channel is around 1.1830, which is a target for the bulls today or tomorrow.
The EURUSD has been sideways for 3 hours. While the bears hope this trading range is a bear flag, the spike and channel bottom make it more likely a reversal pattern for a 50 pip rally. Day traders will probably mostly scalp, but they might get a 30 – 50 pip swing up today. Less likely, the bear trend will continue.
Summary of today’s S&P Emini futures price action and what to expect tomorrow
The Emini sold off from yesterday’s high, but reversed up below the low of last week. It was mostly a trading range day.
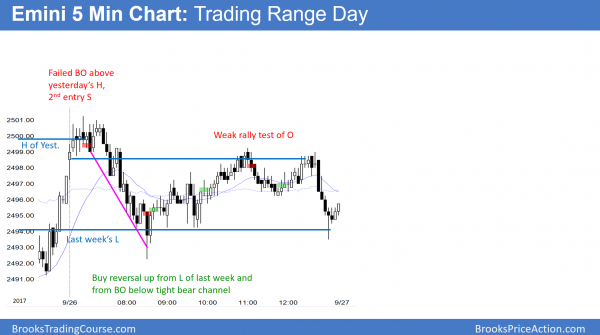
The Emini again went below last week’s low, and again reversed up. Yet, both the selloff and rally were weak. It traded back down to last week’s low at the end of the day, again triggering the weekly sell signal. However, this was mostly another trading range day in the 10 day tight trading range. The Emini will continue with trading range days until there is finally a strong breakout. While there is no evidence that one is about to begin, the monthly buy climax is extreme. Consequently, the odds favor a 100 – 200 point selloff within the next 2 months. Yet, there might be one more brief new high first.
See the weekly update for a discussion of the price action on the weekly candlestick chart and for what to expect going into next week.
Traders can see the end of the day bar-by-bar price action report by signing up for free at BrooksPriceAction.com. I talk about the detailed S&P Emini futures price action real-time throughout the day in the BrooksPriceAction.com trading room. We offer a 2 day free trial.
When I mention time, it is USA Pacific Standard Time (the Emini day session opens at 6:30 am PST, and closes at 1:15 pm PST). You can read background information on the intraday market reports on the Intraday Market Update page.


