Trading Update: Wednesday May 11, 2022
Emini pre-open market analysis
Emini daily chart
- Emini testing March 2021 gap on the daily chart yesterday. The bears want to close below the gap as well as the March 17, 2021, breakout point, which would demonstrate the strength of the bears.
- The bears closed below the three-month trading range on May 9, and yesterday was a second bear close below the 3-month range.
- While this is two consecutive bear bars and a sign of strength by the bears, the bodies are overlapping each other, which is a sign of weakness and trading range price action.
- The market is forming a broad bear channel on the daily chart, with the high of the bear channel being January 4 and the lower high on March 29. The bottom of the channel might be October 4, February 24, and May 9-10.
- If this market is in a bear channel would argue the bears are currently trying to break below it and will likely fail. If they fail, the market should reverse up back into the 3-month trading range and ultimately test the top of the bear channel.
- The bulls need a strong reversal up to convince traders that the bear breakout below the 3-month range is failing. Without a bull breakout or 3-4 consecutive strong bull trend bars, traders will wait for a better setup such as a micro double bottom.
- The bears see two consecutive bear bars breaking below the 3-month range and are hoping for a measured move down, which would project around 3,600. That would be a 25% correction.
- The bears’ next target would be a measured move from the 2022 high to the February low, which would project down to around 3,400. This would be a 29% correction.
- The market is currently at a 16% correction and may have to reach a 20% correction. However, the market is at important support, the gap between April 2021 and the March 2021 breakout point. This means the market may reverse at this price level.
- A 16% correction will be enough to attract value investors to buy. The value investors willing to buy a 16% correction will be thrilled to by a 20% or 25% correction which means the market is at an attractive price level for investors to begin buying.
- It is possible the market continues to sell off; however, more likely, the market will begin to go sideways to up here.
Emini 5-minute chart and what to expect today
- Emini is down 10 points in the overnight Globex session.
- The Globex market had a sharp selloff after the 5:30 AM PT CPI reports this morning.
- The Globex market is testing yesterday’s low and may open around this price level.
- Today will be an important day for traders to see how strong the bulls are. Can they stop the selling, or will the bears get another bear bar on the daily chart closing on its low, increasing the odds of lower prices.
- Traders should expect the bears to get disappointed today and for the market to be in a trading range or possible bull trend day. The less likely would be a bear trend day.
- Overall, traders should consider waiting for 6-12 bars before trading if they find the open difficult. Traders should also consider waiting for a credible stop entry or a strong breakout with follow-through.
Yesterday’s Emini setups

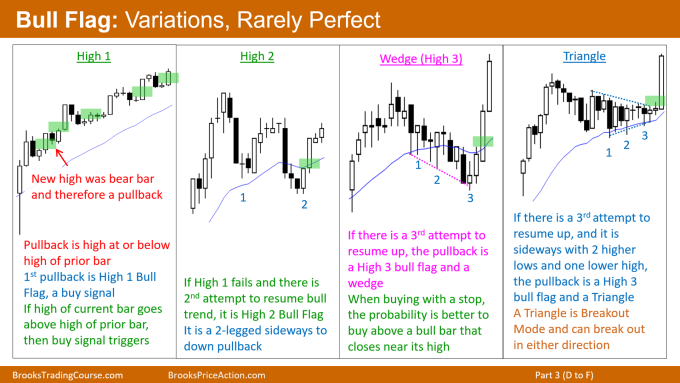
today I am including a sample general information slide from the Encyclopedia below.

Al created the SP500 Emini charts.
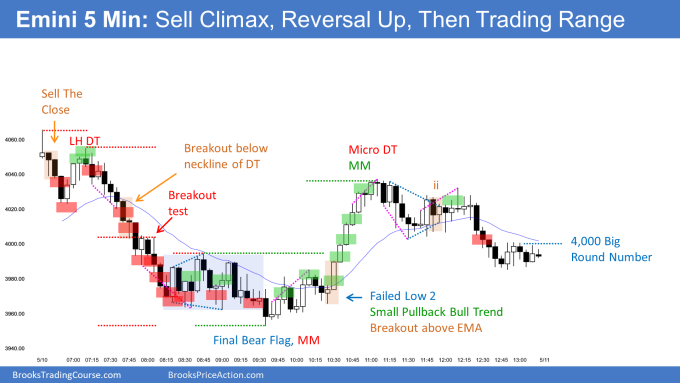
Above are several reasonable stop entry setups from yesterday. I show each buy entry with a green rectangle and each sell entry with a red rectangle. Buyers of both the Brooks Trading Course and Encyclopedia of Chart Patterns have access to a much more detailed explanation of the swing trades for each day (see Online Course/BTC Daily Setups).
My goal with these charts is to present an Always In perspective. If a trader was trying to be Always In or nearly Always In a position all day, and he was not currently in the market, these entries would be logical times for him to enter. These therefore are swing entries.
It is important to understand that most swing setups do not lead to swing trades. As soon as traders are disappointed, many exit. Those who exit prefer to get out with a small profit (scalp), but often have to exit with a small loss.
If the risk is too big for your account, you should wait for trades with less risk or trade an alternative market like the Micro Emini.
EURUSD Forex market trading strategies
EURUSD Forex daily chart

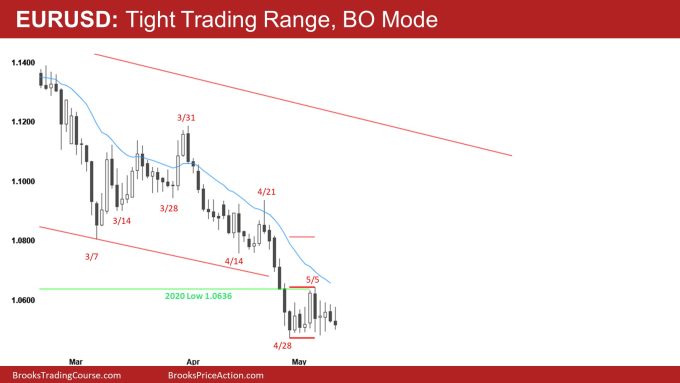
- The EURUSD has been in a 10-bar tight trading range on the daily chart. This is a triangle on a smaller time frame. This is a breakout mode situation, and the probability is close to 50% for the breakout up or down.
- Bears want a second leg down from the April 21 selloff.
- The bulls see the 10-bar tight trading range as a final flag and want an upside breakout that would test the April 25 high and the bottom of the March – April trading range.
- The Market is deciding if the April 21 bear breakout will lead to a measuring gap or exhaustion gap.
- The odds favor an exhaustion gap and the market ultimately testing the April 21 high. However, the market may get a small second leg down first. If the market does get a second leg down, the 10-bar tight trading range would be a final flag.
- Overall, the market will probably break to the upside soon and reach the March – April lows. The lower probability outcome would be the April 25 bear breakout leading to a measuring gap and testing the 2017 low.
Summary of today’s S&P Emini futures price action and what to expect tomorrow

Al created the SP500 Emini charts.
End of day summary
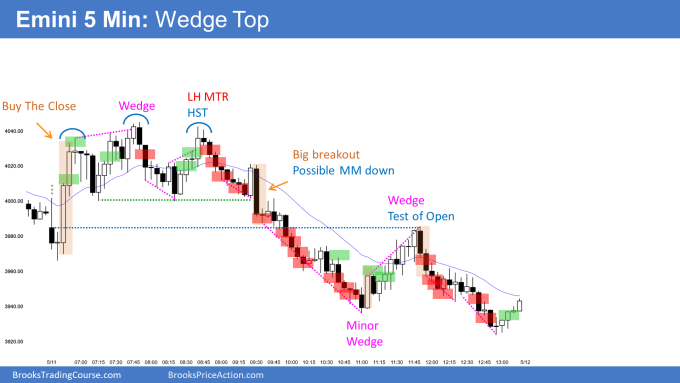
- The Emini formed a double top with the first leg being a wedge that led to a bear breakout and measured move down of the initial trading range.
- The first bar of the day was a big bear bar low in a possible trading range. This increased the odds of a reversal, which the bulls got during 6:45 PT.
- The bull breakout up to 6:50 PT led to a wedge top at 7:50 PT, leading to two legs down, which formed a double bottom with a second entry buy at 8:20 PT.
- At 8:20, the bulls rallied up, testing the top of the wedge at 8:40 PT which formed a double top with the 7:50 PT wedge.
- The market continued sideways, and the bears got a surprise bear breakout at 9:30 PT that led to a measuring gap, trapping scale in bulls.
- The market sold off for several bars and had a deep rally testing the open of the day at 11:55.
- When the market reverses down after an initial rally that is half the size of an average range, the market will often selloff a measured move down from the high of the day to the open of the day projecting down.
- The Emini closed the March 2021 Gap today.
- This is the third consecutive bear bar and a sign of strength by the bulls.
- While it is possible the market keeps going lower without a brief rally up, the bears will likely begin to take profits at this price level, and the market will have to bounce.
See the weekly update for a discussion of the price action on the weekly chart and for what to expect going into next week.
Trading Room
Traders can see the end of the day bar-by-bar price action report by signing up for free at BrooksPriceAction.com. Al talks about the detailed S&P Emini futures price action real-time throughout the day in the BrooksPriceAction.com on trading room days. We offer a 2 day free trial.
Charts use Pacific Time
When times are mentioned, it is USA Pacific Time. The Emini day session charts begin at 6:30 am PT and end at 1:15 pm PT which is 15 minutes after the NYSE closes. You can read background information on the market reports on the Market Update page.

