Emini stock market crash on 5 minute chart
Updated 6:38 a.m.
The Emini reversed up from below yesterday’s low, and yesterday’s sell climax was extreme. The odds are that the Emini will rally to above the final sell climax high at around 2700 by the end of the week. Because yesterday was a huge sell climax, there is a 75% chance of at least 2 hours of sideways to up trading today that will begin by the end of the 2nd hour. While there is a 50% chance of follow-through selling within the 1st 2 hours, there is only a 25 % chance of another big bear day. The odds are that the Emini will start to go sideways on the 5 minute chart and the daily chart.
The strong buy signal bar and good entry bar made the Emini Always In Long. There is a 50% chance that this is the low of the day. The odds are that today will be a trading range day or a bull trend day. Yet, because the bars are huge, most traders should not day trade.
Pre-Open market analysis
For the past month, I have been writing that the stock market has never been this overbought on the daily, weekly, and monthly charts in the 100 year history of the Dow and S&P indices. Furthermore, I said that a 5% correction was likely to begin within weeks. The market is now down almost 10%, and many traders will wait at least a month before buying again.
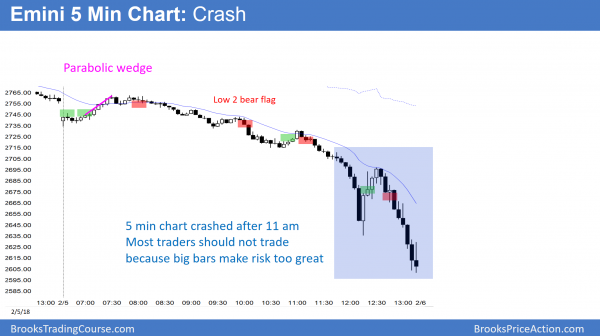
Yesterday’s crash on the 5 minute chart achieved all of the immediate goals of the bears on the higher time frames. The stock market tested the 20 week EMA, fell below last month’s low, and corrected 5%. Since the selloff was strong, it will probably continue lower, and possibly for several months. The next target is the November 15 low of 2558.25, which was the start of the tight bull channel on the daily chart. The target after that is a measured move down based on the height of the January buy climax. That target is around 2450.
Importance of the August 8 high of 2489.50 high
That measured move is below the August 8 high of 2489.50. I have mentioned this price many times. The September 25 low was a test of that breakout point. Since it was a small doji day, it was not a good foundation for a huge rally. Therefore traders should look at it as being unable to support the January rally. Consequently, the bulls want more support. This means that this selloff might have to retest that August 8 high before the bulls will buy again.
The bulls will want at least a micro double bottom over the next few days, or a double bottom over the next 2 months, before they will buy aggressively again. They prefer the double bottom to begin to form now, but the bears might be able to drive the market down to around 2450 first.
Big bars so trade small or not at all
The bars will probably be big again today. If they are, the risk would be very big. Day traders, if they are trading, should trade very small. Most should simply wait for smaller bars. Because yesterday was so extremely climactic, there is an increased chance of a reversal today. It could come on the open, or at any point during the day. Furthermore, it could be violent.
Stock market crash on 5 minute chart, but not daily chart
I said this is a crash on the 5 minute chart. Can it become one on the daily chart? I was trading on the day of the 1987 Crash. Yesterday was no crash on the daily chart and it is unlikely to become one. Yesterday fell 5%. The 1987 Crash fell 25% in one day. As scary as today was for beginners, the 87 Crash was 5 times bigger! That is probably unimaginable for new traders, but that is the fact. The bears need to do much more to turn this into a crash.
There is one important similarity with the 87 Crash. There was no clear fundamental reason for it to happen. And that is true now as well. I have talked about the reason for this selloff many times. It is purely technical. The stock market has never been this overbought (read any of my weekend blogs), and it is simply undoing the excess.
Overnight Emini Globex trading
The Emini is down 27 points in the Globex session. However, it was down about 100 points earlier overnight. The bars on all time-frames are huge. This means that stops are far away, which creates extreme risk. Most day traders should wait for the bars to become smaller before trading.
This sell climax is extreme. Therefore the Emini will probably rally strongly today or tomorrow. The 1st target is the top of yesterday’s final sell climax, which is around 2700. While it is possible that the Emini might go straight up to the all-time high, when a bear breakout is this strong, most bulls will not want to buy until there is at least a micro double bottom. As a result, the strong January rally and big February selloff will probably lead to a trading range over the next month. Since the range so far is about 300 points tall, there will be huge rallies and selloffs over the next few weeks. It will probably take a couple of months before the size of the bars on the 5 minute chart are back to normal.
Yesterday’s setups
Here are several reasonable stop entry setups from yesterday. I sometimes also show limit order entries and entries on the close of bars.
EURUSD sideways to down to 1.2200
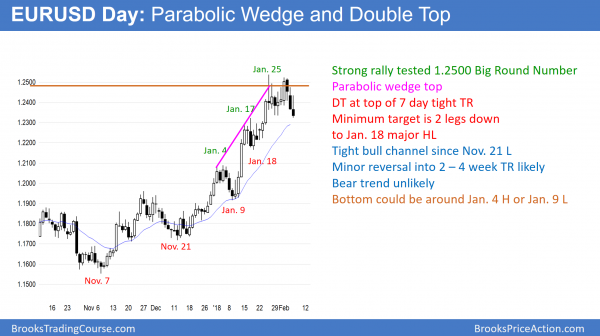
The EURUSD daily Forex chart has sold off for 3 days from a double top and a parabolic wedge top. The selloff will probably test below the January 18 low at around 1.2200.
Buy climaxes usually have at least 2 legs down and last at least 10 days.
The bulls will be hesitant to buy aggressively until the daily chart reaches these goals and it is at support. Therefore, traders will hold shorts and sell rallies over the next 2 weeks, unless there is a surprising sharp bull breakout. The daily chart is probably entering a trading range that will last 1 – 2 months. It has a reasonable top, and it now is probing down to find the bottom.
Overnight EURUSD Forex trading
The EURUSD 5 minute Forex chart sold off 100 pips overnight. It is now at the bottom of a 9 day trading range. Furthermore, it is near the support of the 20 day exponential moving average and the January 17 high. Bear legs in trading ranges usually fall below support before reversing up. Therefore, this selloff will probably fall to at least 1.2300 before bouncing. Day traders will begin to look to buy around there today. But, since a 2nd leg down to lower support is likely over the next few weeks, traders will sell any 2 – 3 day rally for a test down to at least the 1.2200 area.
Summary of today’s S&P Emini futures price action and what to expect tomorrow
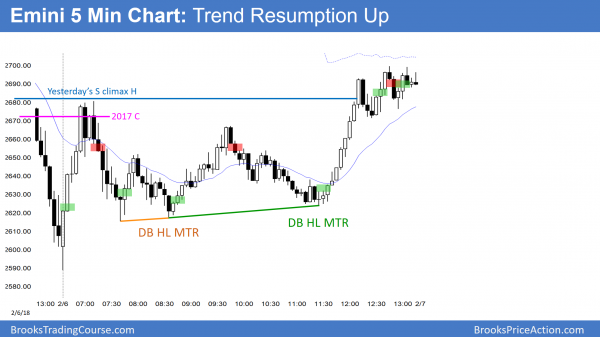
The Emini reversed up sharply on the open from a 10% correction. It then resumed up after a higher low major trend reversal.
The Emini reversed up from below yesterday’s low at exactly a 10% correction from the all-time high. It then was sideways until the final hour. It then resumed up from a higher low major trend reversal. The bulls hope that this selloff is just a 2nd leg trap down in a bull trend on the daily chart. If they get follow-through buying over the next week, the odds will shift in their favor. At the moment, a 2nd leg down on the daily chart is still slightly more likely at some point over the next few weeks.
The Emini will probably have lots of big swings for at least a couple more weeks. Unless day traders have big accounts, they should not trade until the 5 minute bars get smaller.
See the weekly update for a discussion of the price action on the weekly candlestick chart and for what to expect going into next week.
Traders can see the end of the day bar-by-bar price action report by signing up for free at BrooksPriceAction.com. I talk about the detailed S&P Emini futures price action real-time throughout the day in the BrooksPriceAction.com trading room. We offer a 2 day free trial.
When I mention time, it is USA Pacific Standard Time (the Emini day session opens at 6:30 am PST, and closes at 1:15 pm PST). You can read background information on the intraday market reports on the Intraday Market Update page.


