Trading Update: Tuesday April 30, 2024
S&P Emini pre-open market analysis
Emini daily chart
- The Emini formed a doji bar closing with a 1-tick bull body, slightly above the moving average on the daily chart. The market may go sideways until the release of tomorrow’s FOMC report.
- The bulls are hopeful that today, they will break far above the moving average, increasing the odds of an upside breakout of the bear flag and measured move up.
- The bears want the bulls to fail at the moving average, leading to a bear reversal bar. If the bears can get a bear reversal bar, that would create a two-legged pullback (Low 2) at the moving average. Next, the bears would want a downside breakout and test of the April low.
- Since the bull channel up from the January low is tight, that increases the odds the first reversal down (April low) will fail, and the bears will need a major trend reversal.
- This means that the market will likely have to test back up to near the March highs before the bears have a chance at a credible reversal.
- This means that the bulls may get an upside breakout above the moving average, creating a more credible Major trend reversal.
- Overall, traders should expect the market to go sideways over the next couple of days. Tomorrow is an FOMC day, meaning the market may go sideways as traders decide what the Fed will do with interest rates.
Emini 5-minute chart and what to expect today
- The Globex market formed a tight trading range for most of the overnight session.
- The bears formed a downside breakout during the 8:30 AM EST report bar. However, it was a test of yesterday’s late climactic selloff testing the 60-minute moving average.
- Bulls want a double bottom with yesterday’s low and a bull reversal of the 8:30 AM EST report.
- This means that traders should expect a test of the 8:45 AM EST high (15-minute chart) if the bulls get a successful reversal. Next, traders should pay attention to a possible measured move-up of the bear breakout.
- As always, traders should expect trading range price action on the open until proven otherwise.
- Today is the final day of the month, so monthly support and resistance is important. Traders should pay attention to the month’s midpoint (5,154.25) and the low of last month (5,126.5).
- Lastly, traders should be ready for a surprise breakout late in the day as traders decide on the close of the monthly chart.
Emini Intra-day update
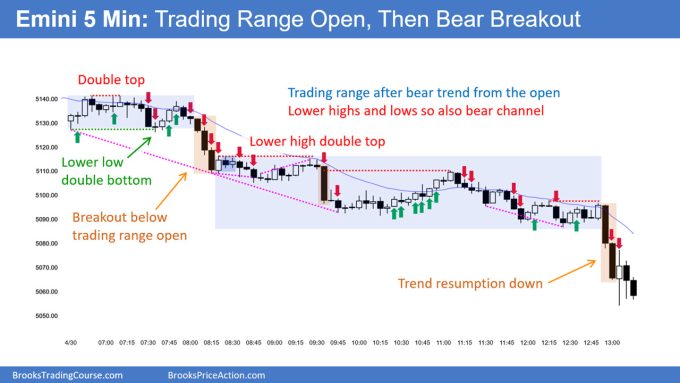
- The bulls are trying to get a trend from the open bull trend. As of bar 3, the market is Always In Long and likely to get a second leg up from the bar 3 upside breakout.
- The market formed a trading range for the first 18 bars of the day.
- The bulls tried to get a double bottom with bars 1 and 13. However, they failed, and the bears formed a downside breakout with bars 19 and 20.
- While the selloff is strong, as of bar 30, the market is going sideways and developing buying pressure. This increases the odds of a trading range and a test of yesterday’s Bar 68 low (low of yesterday).
- The bears formed a wedge top with 36 and got the downside breakout, which was also a second leg down from the bar 21 selloff.
- The bulls are hopeful that this is a consecutive sell climax that will lead to a reversal up. However, they need to create more buying pressure in order to get a strong reversal. At the moment, the best the bulls can hope for is sideways.
- The bulls were able to make the market go sideways for several bars (bar 49). Increasing the chances of a rally. The bulls were able to get an upside breakout on bar 53. This increases the odds of a measured move from the 45 low to the 51 high, projecting up to near yesterday’s low.
Friday’s Emini setups

Al created the SP500 Emini charts.
Here are reasonable stop entry setups from Friday. I show each buy entry bar with a green arrow and each sell entry bar with a red arrow. Buyers of both the Brooks Trading Course and Encyclopedia of Chart Patterns have access to a near 4-year library of more detailed explanations of swing trade setups (see Online Course/BTC Daily Setups). Encyclopedia members get current daily charts added to Encyclopedia.
My goal with these charts is to present an Always In perspective. If a trader was trying to be Always In or nearly Always In a position all day, and he was not currently in the market, these entries would be logical times for him to enter. These therefore are swing entries.
It is important to understand that most swing setups do not lead to swing trades. As soon as traders are disappointed, many exit. Those who exit prefer to get out with a small profit (scalp), but often have to exit with a small loss.
If the risk is too big for your account, you should wait for trades with less risk or trade an alternative market like the Micro Emini.
Summary of today’s S&P Emini price action

Al created the SP500 Emini charts.
End of day video review
End Of Day Review will be presented in the Trading Room today. See below for details on how to sign up.
See the weekly update for a discussion of the price action on the weekly chart and for what to expect going into next week.
Trading Room
Al Brooks and other presenters talk about the detailed Emini price action real-time each day in the BrooksPriceAction.com trading room days. We offer a 2 day free trial.
Charts use Pacific Time
When times are mentioned, it is USA Pacific Time. The Emini day session charts begin at 6:30 am PT and end at 1:15 pm PT which is 15 minutes after the NYSE closes. You can read background information on the market reports on the Market Update page.

