Trading Update: Thursday March 24, 2022
Emini pre-open market analysis
Emini daily chart
- Emini reversal up from low 1 pullback with market finally getting a bear close yesterday after five consecutive bull closes.
- With yesterday triggering a low 1 (L1) short, odds are this L1 will lead to a 1-3 day pullback. The pullback might be sideways.
- The bulls will likely get a second leg up from the strong 6-bar rally, and probably test the 4,600 price level, which is also the top of the channel (March 9).
- The bears hope that a second leg up leads to a micro double top with a bear bar closing on its low, setting up a credible stop entry short and a double top lower high major trend reversal with the March 9 High.
- As strong as the bull rally is that started last week, traders must remember that the market is in a trading range, and the bulls are likely to become disappointed soon.
- What are the odds the market resumes last week’s bull breakout and races up to the all-time high? While it is possible, it is more likely that the rally up will look weak.
- The bears will be interested in selling at this price level, and bulls will likely be interested in taking profits up here rather than buying aggressively close to the all-time high.
- Overall, traders should expect the market to start going sideways again soon, as the market decides on a breakout to the all-time high or a test of the February low.
Emini 5-minute chart and what to expect today
- Emini is up 20 points in the overnight Globex session.
- The bulls have had a rally during the Globex session.
- It is possible today will be a bull trend day. Yesterday triggered a low 1 on the daily chart, so there may be a lot of buyers buying here, betting on a test of Tuesday’s high.
- Since the market will gap up, traders should pay close attention to the first couple of bars. If they are sideways, traders should wait for the market to get closer to the moving average and look for a credible stop entry or breakout with follow-through.
- if the market forms a trend from the open with strong bull bars and context is appropriate, it is okay to buy as long as one can make quick decisions regarding getting out. Remember, 50% of the time, there is a major reversal on the open (March 21 is an example).
Yesterday’s Emini setups

Al created the SP500 Emini charts.
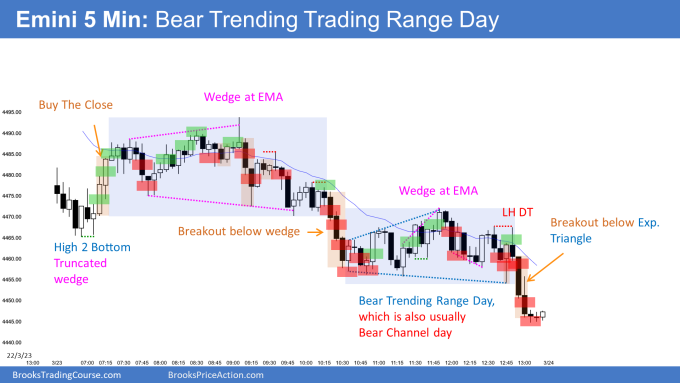
Here are several reasonable stop entry setups from yesterday. I show each buy entry with a green rectangle and each sell entry with a red rectangle. Buyers of both the Brooks Trading Course and Encyclopedia of Chart Patterns have access to a much more detailed explanation of the swing trades for each day (see Online Course/BTC Daily Setups).
My goal with these charts is to present an Always In perspective. If a trader was trying to be Always In or nearly Always In a position all day, and he was not currently in the market, these entries would be logical times for him to enter. These therefore are swing entries.
It is important to understand that most swing setups do not lead to swing trades. As soon as traders are disappointed, many exit. Those who exit prefer to get out with a small profit (scalp), but often have to exit with a small loss.
If the risk is too big for your account, you should wait for trades with less risk or trade an alternative market like the Micro Emini.
EURUSD Forex market trading strategies
EURUSD Forex daily chart

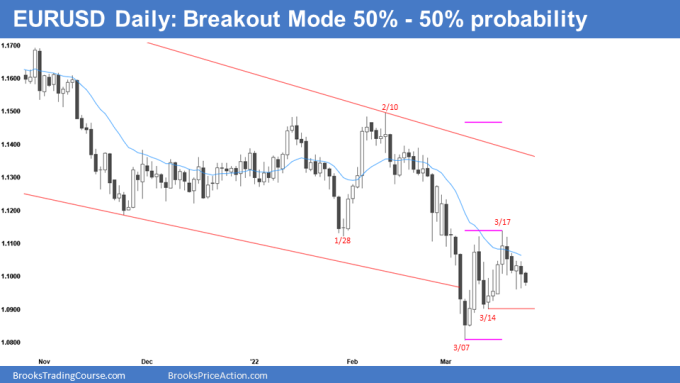
- The market is in the middle of the March range, this is breakout mode which means probabilities are close to 50%-50% regarding a test of the March high, compared to the March Low.
- So far, the bears have a 5-bar bear micro channel; this is a sign of strength by the bears.
- The bears have a credible double top with March 10. Go to Al’s encyclopedia of chart patterns and look at all the double top bear flags, and you will notice that it is common for the second leg up in the double top to appear strong, yet, 40% of the time the market reaches the neckline of the double top.
- My point is the bears have at least a 40% chance of testing the neckline here (March 7) and possibly getting the breakout below it.
- Often, double tops have weak follow-through, such as March 22 – 23, which makes it hard to stay short if one sold the double top below March 21.
- The bulls are hopeful that the market will form a double bottom higher low major trend reversal at the March 14 low. Next, the bulls would want a bull breakout of the bear flag (March 17 high).
- Note: I am leaving the measured move projection of the bull breakout above the bear flag (purple line) because I still think this is most likely (not yet 60% probability, though).
- The market broke below a major bear channel back in early March, so the odds are the market will test the top of the bear channel. It is important to remember that the market can reach the top of the bear channel by going sideways for a long enough period of time.
- Lastly, the odds are the 3-month trading range is a final flag, which means the market is likely to test back into the 3-month trading range.
Summary of today’s S&P Emini futures price action and what to expect tomorrow

Al created the SP500 Emini charts.
End of day summary
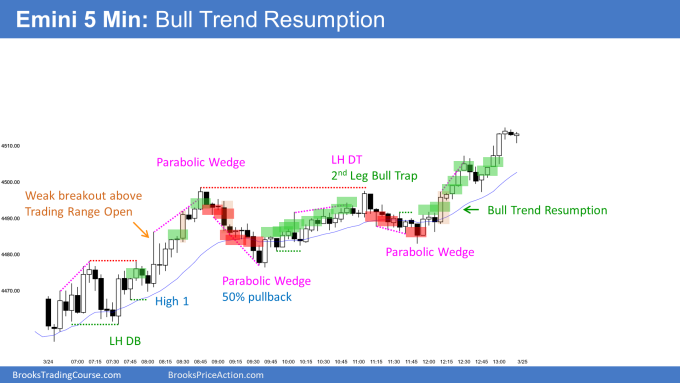
- The market opened as a trading range which led to a weak breakout above the range around 8:05 am.
- The 8:05 am breakout led to a wedge top that was also a second failed breakout of Yesterday’s high.
- The rally up to 8:45 was a tight channel, and although the odds were that the bears would get two legs sideways to down after the wedge top, the odds were any selloff would be minor at best for the bears.
- The bears got selloff around 9:40, which was much more profound than bulls hoped for. This means bulls would be eager to exit on any rally, disappointed by the selloff. Also, 8:45 am was a reasonable buy the close bar that was never retested, so there were likely trapped bulls back at this close, which means bulls would be happy to exit back at their entry price on any bounce around 11:05.
- The rally up to 11:05 was tight, which made any selloff likely minor, and the bull would likely need a retest before the bears would get a chance at a major trend reversal.
- The 12:10 bull breakout was too strong of a retest, leading to an upside breakout into the close.
- Overall, today was a trading range day, and if you take away the final hour of the day, the rest was sideways trading. It is essential on days like today to not get sucked into buying too high or selling too low.
See the weekly update for a discussion of the price action on the weekly chart and for what to expect going into next week.
Trading Room
Traders can see the end of the day bar-by-bar price action report by signing up for free at BrooksPriceAction.com. I talk about the detailed S&P Emini futures price action real-time throughout the day in the BrooksPriceAction.com on trading room days. We offer a 2 day free trial.
Charts use Pacific Time
When I mention time, it is USA Pacific Time. The Emini day session charts begin at 6:30 am PT and end at 1:15 pm PT which is 15 minutes after the NYSE closes. You can read background information on the market reports on the Market Update page.

