Emini pausing at resistance while Trump decides on Syria attack
Updated 6:45 a.m.
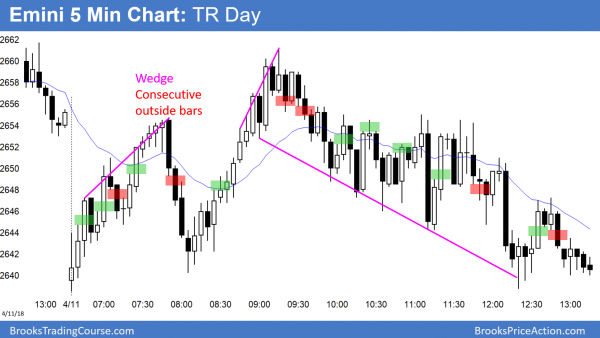
Today opened just above yesterday’s low. Since yesterday was at the top of a 3 week trading range, it is a sell signal bar, even though it had a bull body. Therefore, the Emini today might have to go below yesterday’s low. However, yesterday’s low is support, as is the 60 minute moving average. Consequently, the Emini will probably not selloff strongly on the open. Furthermore, it is far below the EMA, and many traders do not like to sell far below the average price.
The bulls want an opening reversal up from around yesterday’s low and the 60 minute moving average. Yet, unless today goes above yesterday’s high, the odds favor a 2nd leg down after a 2 day wedge lower high. Consequently, there will probably be sellers around the EMA. Traders will look to sell a sideways to up move to the EMA.
The 1st bar had a big tail and was therefore a trading range bar. So far, today looks like a continuation of yesterday’s range. The odds are that the bears will sell a 2 – 3 hour rally for a 2nd leg down from the wedge. The bulls will buy below yesterday’s low. Unless there is a strong breakout up or down, the odds favor a mostly quiet day.
Pre-Open market analysis
The Emini gapped up yesterday and went sideways. It is at the top of a 3 week trading range and just below the 20 day EMA. If the bulls get a breakout, a measured move up is around 2800 and the March 13 major lower high.
The bears want a reversal down today or tomorrow and then a break below the February low. If they get it, the next target is around 2450 for the many reasons I discussed over the weekend.
Because the Emini is at major resistance, there is an increased chance of a strong move up or down. However, the Emini has inertia. That means that today will most likely be sideways, like yesterday.
Overnight Emini Globex trading
The Emini is down 23 points in the Globex session. This reduces the chance of a strong bull trend day today. Because it is testing the top of a 3 week trading range and turning down, there is an increased chance of a bear trend day. This is especially true since yesterday was the top of a 2 day wedge. The first target is always the most recent higher low in the wedge. That is yesterday’s low. Next, the bulls want to test the bottom of the wedge. That is the April 6 low, below 2590.
The bulls correctly see the wedge as a bull channel. They want any selloff to reverse up from a higher low and then break to another new high in the channel. They therefore will buy around yesterday’s low, and especially above the 2610.00 low of Monday’s close. That is a major higher low and therefore an important magnet for today. A strong break below would probably lead to a test of Monday’s low.
Yesterday’s setups
Here are several reasonable stop entry setups from yesterday. I sometimes also show limit order entries and entries on the close of bars.
EURUSD bull leg in 4 month trading range
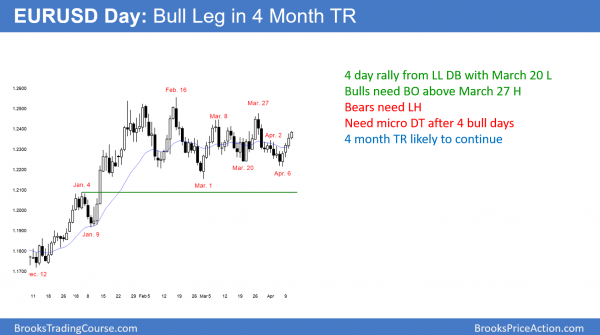
The EURUSD daily Forex chart has rallied for 4 days after a double bottom. Since the bars have good bodies and have closed near their high, the rally should test the March 27 lower high.
The EURUSD rallied for 4 days from a double bottom with March 20 and April 6. The momentum up is strong enough so the odds favor a test of the March 27 high. If the bulls can get at least 20 pips above that high, they will next test the February 16 top of the 4 month trading range. Because the weekly chart is in a bull trend, a bull breakout is more likely than a bear breakout.
The bears have been able to revers the last several strong rallies. They know that most breakout attempts fail. However, a break above the March 27 high will make it likely that this rally will lead to a new high. The next target is a bear trend line on the monthly chart that is just above the February high.
Overnight EURUSD Forex trading
The EURUSD 5 minute Forex chart has been in a broad bull channel since the overnight low. In addition, the 4 hour rally was only 35 pips. A broad channel typical converts into a trading range. Therefore, that is what is likely today. Consequently, bears will look for sell setups, despite the 4 day rally. The bull day traders will continue to buy, but now will switch to buying pullbacks. Moreover, they will take 10 – 20 pip profits instead of swing trading.
Summary of today’s S&P Emini futures price action and what to expect tomorrow
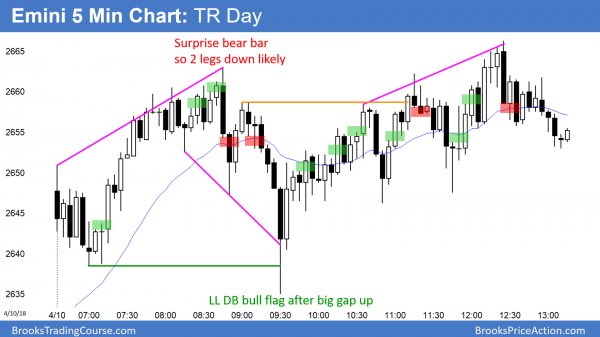
The Emini gapped down and then rallied for 2 legs. There was a deep pullback after the 1st leg up. That made the day likely to remain a trading range day. It sold off over the next 4 hours to test the low.
Today had many reversals and it was therefore a trading range day. It is a doji inside bar on the daily chart. Hence, it is a low probability sell signal bar for tomorrow. Since it is a the top of a 3 week trading range, it is a weak buy signal bar. The odds favor another sideways day tomorrow.
See the weekly update for a discussion of the price action on the weekly candlestick chart and for what to expect going into next week.
Traders can see the end of the day bar-by-bar price action report by signing up for free at BrooksPriceAction.com. I talk about the detailed S&P Emini futures price action real-time throughout the day in the BrooksPriceAction.com trading room. We offer a 2 day free trial.
When I mention time, it is USA Pacific Standard Time (the Emini day session opens at 6:30 am PST, and closes at 1:15 pm PST). You can read background information on the intraday market reports on the Intraday Market Update page.


