Emini nested top reversal down
Updated 6:53 a.m.
While the Emini gapped up and traded above yesterday’s high, the 1st several bars overlapped and had prominent tails. This trading range price action is similar to yesterday’s open, and it reduces the chances of a strong trend day. Yet, there will probably be at least one swing up and one swing down. Today might continue in a limit order market for an hour or two before it breaks out. Until the range gets bigger, most traders should just wait for the breakout up or down.
The bears want a Double Top Lower High Major Trend Reversal with yesterday’s high. The bulls see the gap up as a breakout of a 2 day bull flag. Both are right, but neither is in control yet.
If the breakout is strong, traders will trade in its direction, expecting at least a 2nd leg. If it is weak, they will look for a reversal.
Pre-Open Market Analysis
Yesterday sold off from a Lower High Major Trend Reversal. While the initial bear breakout was strong, the rest of the day was in a broad bear channel. Hence, it was a weak bear trend day. If today gaps down, the bears would have a 4 day island top.
The bulls see every selloff as a bull flag. They will buy a gap down open and try to trap the bears. They therefore would want to trade above yesterday’s low, which is where bears would begin to buy back their shorts.
Nested top
It is most noteworthy that the gap would be coming after a nested Top. Significantly, the top was nested on 5 time frames from the 5 minute to the monthly charts. The pattern was both a Final Bull Flag and an Expanding Triangle top. A nested pattern has a higher probability of being profitable because bears from other time frames are also selling. More sellers increases the chances of lower prices.
Increased risk of climactic top
I mentioned yesterday that when a topping pattern is reasonably obvious, weak bears might sell too much too early. These bears will exit with a loss quickly if the selloff does not begin immediately. The result is that there might be a climactic rally to a new high. Yet, if there is, there probably will not be any strong bulls buying the high. Furthermore, strong bulls will probably see the new high as a gift and sell out of their profitable longs. Hence, the strong fast rally might quickly run out of buyer. It therefore could reverse down strongly and form a buy climax and reversal down.
Emini Globex session
The Emini is up 5 points in the Globex session. Yet, it is still forming lower highs on the since Monday’s all-time high. While there is a nested major top in place, only 40% of major reversals actually lead to a major reversal. As a result, traders should expect at least one more new high before any 40 – 100 point correction.
Almost all reversal patterns involve trading ranges. This is because markets usually have to transition to sideways before they go in the opposite direction. The current top is a nested Final Flag Top. This means that the bulls correctly see it as a bull flag. Therefore, the odds are greater for a bull breakout. If the trading range grows to 20 or more bars, the pattern would be a Breakout Mode setup. Hence, the probability of the bears would be about the same as for the bulls.
Forex: Best trading strategies
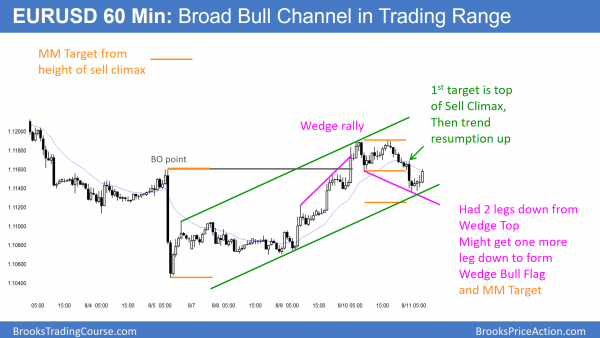
The 60 minute EURUSD Forex chart had 2 legs down from a Wedge Top. While it still might get one more leg down and form a Wedge Bull Flag, this pullback met the minimum objective from the wedge top. The bears need a strong reversal down before traders believe that they are in control. Without that, the chart is a Broad Bull Channel. The first target for the bulls is the top of yesterday’s sell climax. Next, it is yesterday’s high, which is the top of the bull channel.
I mentioned yesterday that while the bull breakout above the top of the August 5 sell climax was strong, it was also a wedge top. Furthermore, it failed to get above the August 7 top of the bull breakout. In addition, that rally was a Spike and Channel Bull Trend. A bear breakout below the channel is usually the start of a trading range. This means that the 3 day rally is probably a bull leg in a trading range instead of the start of a bull trend.
While the rally might even exceed the August 2 wedge top, it will likely lead to a leg sideways to down instead of a bull trend. The bulls need a strong breakout above that August 2 high before traders believe that the rally is a bull trend.
Overnight EURUSD Forex sessions
The EURUSD broke back below the August 5 sell climax high. This is a sign that the bulls are not as strong as they could be. Yet, the 4 day rally is probably a bull leg in a trading range. When there is a trading range, the market usually disappoints bulls and bears. This pullback is consistent with that.
Although the 60 minute chart is in a bull channel, it is a Broad Bull Channel. This has many properties of a trading range, and it is essentially a trading range that is sloped upward. It is therefore not a strong bull trend.
Because the EURUSD 60 minute chart is in a trading range, and uncertainty is a hallmark of a trading range, traders will not be as confident about patterns as they might otherwise be. While the EURUSD has rallied for the past 4 hours, the rally had 3 pushes up. It is therefore a Wedge Bear Flag. Also, it only covered 30 pips and hence was not strong. It also failed to get above the overnight sell climax high. Hence, there is about a 50% chance that it will have one more push down before it goes above yesterday’s high. The quiet overnight trading makes a quiet day likely today.
The August 2 Wedge Top might still be in control
I have mentioned several times that the August 2 Wedge Top might have 2 big legs sideways to down, and that it would likely lead to a big trading range. There is a 50% chance that the selloff that ended August 5 was just the 1st of the two legs down. Hence, the current rally might be the pullback from that 1st leg down. Therefore, there might be one more test down to around the August 5 low before the EURUSD tests the August 2 high at the top of the wedge.
Summary of today’s S&P Emini futures price action and what to expect tomorrow
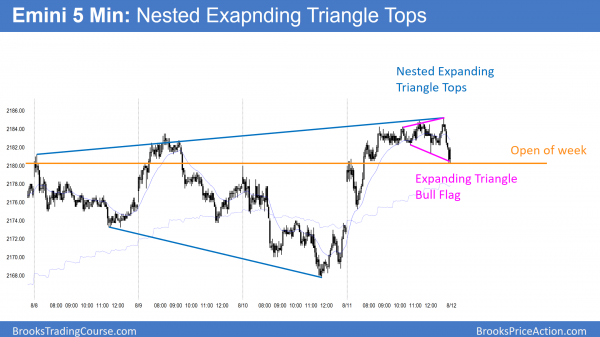
The Emini had an Opening Reversal up from the moving average. After a Wedge Top, it entered a tight trading range for the rest of the day. It has Nested Expanding Triangle Tops, but the smaller one now has evolved into an Expanding Triangle Bull Flag. The open of the week was a magnet today.
After a breakout to a new all-time high, the Emini went sideways for 5 hours. The bulls want trend resumption up to the 2200 area. That is a big round number magnet, and there are also measured move targets there. The bears see a 60 minute Expanding Triangle Top. Because there are magnets just above, the bulls have the edge.
See the weekly update for a discussion of the price action on the weekly candlestick chart and for what to expect going into next week.
Traders can see the end of the day bar-by-bar price action report by signing up for free at BrooksPriceAction.com. I talk about the detailed S&P Emini futures price action real-time throughout the day in the BrooksPriceAction.com trading room. We offer a 2 day free trial.
When I mention time, it is USA Pacific Standard Time (the Emini day session opens at 6:30 am PST, and closes at 1:15 pm PST). You can read background information on the intraday market reports on the Intraday Market Update page.


