Emini island bottom and measuring gap for test of 2800
I will update again at the end of the day
Pre-Open market analysis
The Emini gapped up yesterday and created a month-long island bottom. When there is a successful breakout, the Emini often goes sideways for a few days before resuming up. Therefore, a few sideways days would not significantly weaken the bull case. The monthly chart was likely to turn up within 3 months of breaking below its 15 month bull micro channel. April is the 3rd month. This supports the bull case. There is now a 60% chance that the bull trend is resuming. The bears hope that they can get a gap down any day this week. That would create an island top and erase the bullishness of the island bottom. Alternatively, if they get consecutive big bear days that close yesterday’s gap up, that would also turn the daily chart back to neutral. While it is probably on its way up to 2,800, the daily chart is still in a trading range. Therefore, traders need to expect disappointment. Consequently, there will be 2 – 3 days down in the current month-long rally. However, the odds are that the bulls will buy them and the rally will continue up to 2800.
Overnight Emini Globex trading
The Emini is up 10 points in the Globex market. After a breakout on the daily chart, the Emini often goes mostly sideways for a few days. It sometimes even reverses sharply for a couple of days. Yet, it is now in a bull swing on the daily chart. Therefore, traders will look to buy a reversal after any 1 – 3 day selloff. Yesterday was the 2nd leg up from Friday’s low on the 5 minute chart. The Emini often pulls back after 3 legs. Therefore, there is an increased chance that today will have a swing down. It could last a few hours or even a couple of days. While the odds continue to favor the bulls, they have accomplished their most important goal. They have made traders believe that the trend to 2800 has begun. Some bulls will therefore take profits and look to buy pullbacks. If there are many such bulls, the Emini could begin to pull back today or tomorrow. However, the odds favor a rally to 2800 over the next few weeks. Even though the Emini has rallied for 3 weeks, most of the days have had a lot of trading range trading. That will probably continue. Since profit taking is likely this week, the bears will probably soon get a swing down that lasts at least a few hours. However, the odds are that any bear trend on the 5 minute chart will be a small bull flag on the daily chart. The bears will need several strong bear days to undo what the bulls achieved over the past few days.
Yesterday’s setups
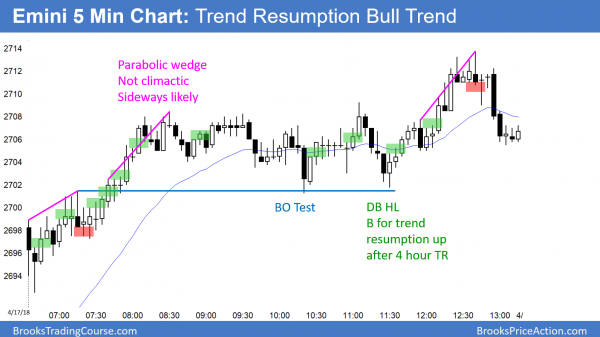
Here are several reasonable stop entry setups from yesterday. I sometimes also show limit order entries and entries on the close of bars.
EURUSD testing top of 3 month triangle
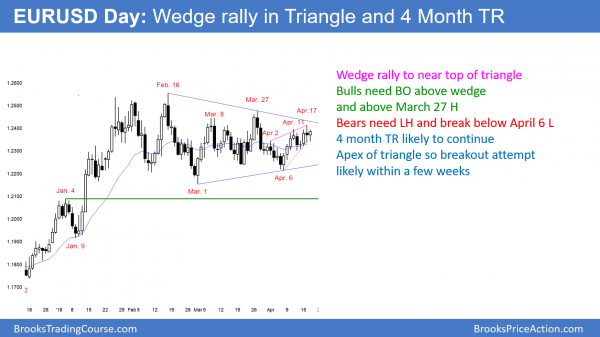
The EURUSD daily Forex chart is rallying up to the bear trend line at the top of a 3 month triangle. There will probably be a breakout within 3 weeks because the triangle is getting tight. Since the trend before the triangle was up, the odds slightly favor a bull breakout.
The EURUSD daily Forex chart is at the apex of a 3 month triangle. Therefore, it will probably break out within a few weeks. There is a 50% chance that the 1st breakout will fail and reverse. Since the weekly chart is in a bull trend, there is a slightly higher chance of a bull breakout. While the bears want a reversal down today from a 3 week wedge rally, a triangle is a trading range. Reversals in trading ranges usually come after going past support or resistance. Because there is obvious resistance at the bear trend line at the top of the triangle, the odds are that the EURUSD will rally at least another 40 pips today or tomorrow. If instead it reverses down before touching the line, the reversal will probably be brief. Resistance is always a magnet, and the odds are that the bears will not be able to take control until after the chart reaches the line. It can get there by going up or sideways. Even then, any selloff will simply be another leg in the trading range. Until there are consecutive strong trend bars breaking out of the range, the odds are that every strong rally or selloff will reverse. Just look at the past 4 months and you will see many strong legs up and down. Every one of them reversed and failed to break out.
Overnight EURUSD Forex trading
The EURUSD 5 minute chart rallied 50 pips overnight. It is being pulled up to the bear trend line on the daily chart, which is about 40 pips above today’s current high. While the bulls do not have to get there today, they should get there this week. Consequently, unless there is a strong reversal down, traders will have a bullish bias today and tomorrow. Because the 5 minute chart has been in a tight range for 6 days, the bears will continue to sell reversals down for scalps. This is true even though the chart has been going up for 3 weeks. Since the chart is near important resistance, there is an increased chance of either a strong breakout up or down within a couple of weeks. Until then, day traders will mostly look for 10 – 20 pip scalps.
Summary of today’s S&P Emini futures price action and what to expect tomorrow
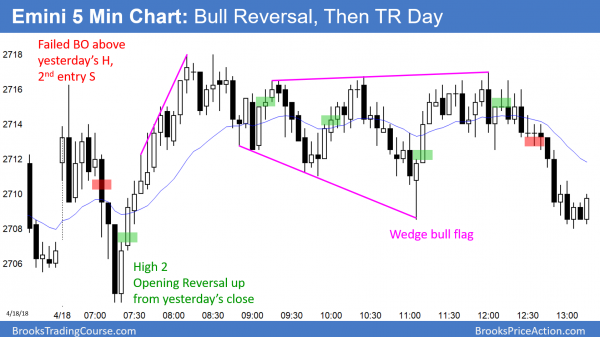
The Emini reversed up strongly from a reversal down from above yesterday’s high. It spent the rest of the day in a trading range.
After an early selloff that reversed up, the Emini then went sideways. The Emini has rallied 3 days in a tight bull channel. Most tight channels end within 3 days. Consequently, the odds are for sideways to down trading tomorrow. However, since the bull trend is resuming on the daily chart, the bulls will buy any 1 – 3 day pullback. This is true even if there is a gap down, creating a small island top
See the weekly update for a discussion of the price action on the weekly candlestick chart and for what to expect going into next week.
Traders can see the end of the day bar-by-bar price action report by signing up for free at BrooksPriceAction.com. I talk about the detailed S&P Emini futures price action real-time throughout the day in the BrooksPriceAction.com trading room. We offer a 2 day free trial.
When I mention time, it is USA Pacific Standard Time (the Emini day session opens at 6:30 am PST, and closes at 1:15 pm PST). You can read background information on the intraday market reports on the Intraday Market Update page.


