Emini Breakout Mode awaiting today’s May FOMC announcement
I will update again at the end of the day
Pre-Open market analysis
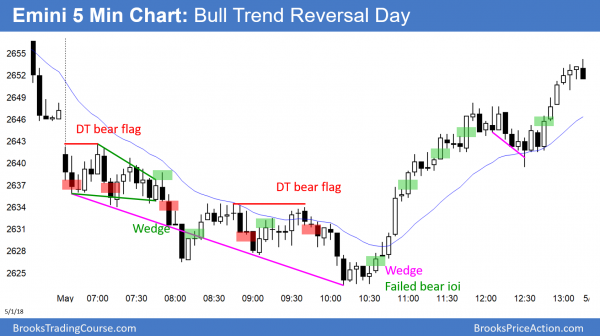
Yesterday began in a weak bear channel and spent most of the 1st 4 hours in tight trading ranges. It reversed up strongly from a wedge bottom in the middle of the day and became a bull reversal day. It is a buy signal bar on the daily chart. Today will probably trade above yesterday’s high to see if there are many buyers there. If there is a strong rally above yesterday’s high, the odds are that the 3 month trading range will end and the monthly bull trend will resume.
The dominant factor for today is the 11 a.m. PST FOMC announcement. Because there is a new Fed Chair and a change in Fed policy, there is an increased chance of a big move up or down after the report. The day will trade like any other day until around 10:30 a.m. Most traders should be flat ahead of the announcement. In addition, the 1st move after the report has a 50% chance of reversing. Therefore, most traders should not look to trade again until at least after the 2nd 5 minute bar.
Overnight Emini Globex trading
The Emini is down 3 points in the Globex market. Since yesterday was a buy climax on the 5 minute chart, the odds favor at least 2 hours of sideways to down trading that starts by the end of the 2nd hour. It might test yesterday’s higher low just below 2640 on the 5 minute chart.
Also, because yesterday was a reasonable buy signal bar on the daily chart, today will probably trade above yesterday’s high at some point. That would trigger the buy signal. Traders want to know if the 3 month correction has ended. If there is a big rally above yesterday’s high, the odds will favor a resumption of the bull trend on the monthly chart. If there is not, the daily chart might continue in its 3 month range indefinitely.
The 11 a.m. FOMC meeting is a likely catalyst for a big move up or down today. Today will trade like any other day for the first several hours. The report will then probably lead to a big move up or down, no matter what takes place before the report.
Yesterday’s setups
Here are several reasonable stop entry setups from yesterday. I sometimes also show limit order entries and entries on the close of bars.
EURUSD parabolic wedge bear breakout
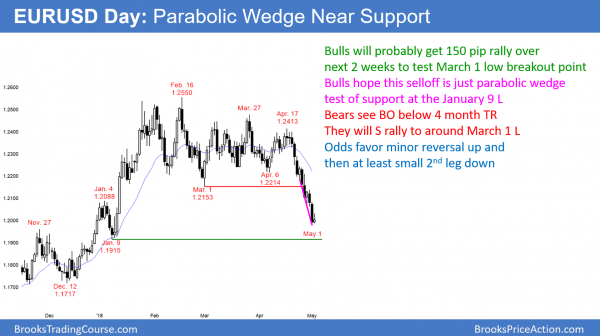
The EURUSD daily Forex chart broke strongly below a 4 month trading range. It is now just above support at the January 9 major higher low. The selloff has 3 small legs in a tight bear channel. It is therefore a parabolic wedge.
The EURUSD daily Forex chart is in a strong bear breakout below a 4 month trading range. There is no bottom yet and there is a magnet below. That is the January 9 major higher low.
However, the bear channel is tight and has had 3 small pushes down over the past 7 days. It is therefore a parabolic wedge. As with any small wedge, the odds favor 2 small legs up within 2 weeks, and they should begin within a week. The bounce will probably test the March 1 low bottom of the trading range. Consequently, it will be about 150 pips.
Because the past 2 days were big, the bears might get one more brief push down before the bounce. Furthermore, since the 3 week bear channel is tight, the 1st reversal up will be minor. Consequently, the bulls will take quick profits and the bears will sell around resistance. That resistance will probably be around the March 1, which is the bottom of the trading range, and the 20 day EMA. It could also be around a 50% pullback and the April 6 low.
As a result, the bulls will probably get about a 150 pip rally over the next 2 weeks. Then, the bears will sell again. Their minimum goal will be a test of this week’s low.
Overnight EURUSD Forex trading
The EURUSD 5 minute chart has been in a 30 pip range overnight. This has given day traders few trading opportunities. Traders are waiting for today’s 11 a.m. FOMC announcement. Day traders should not hold positions going into the report.
The odds favor a big breakout up or down after the report. There is a 50% chance that the 1st breakout will reverse within 10 minutes. Traders should therefore not resume trading until at least 10 minutes after the report.
If the breakout is down, it will probably reverse up within a couple of days because of the parabolic wedge on the daily chart. If it is up, the rally will likely last only a few days and end around the March 1 low.
Summary of today’s S&P Emini futures price action and what to expect tomorrow
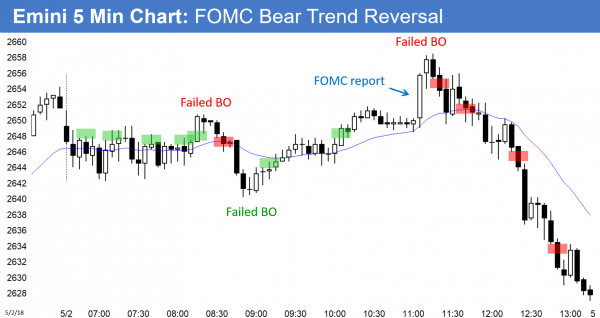
The Emini rallied on the FOMC report, but reversed down strongly from above yesterday’s high.
By trading above yesterday’s high, today triggered a buy signal on the daily chart. However, the Emini reversed down strongly and closed near its low. It is therefore a sell signal bar for tomorrow.
If there is strong follow-through selling tomorrow, the odds will favor another test of the bottom of the 4 month trading range. In any case, the bulls needed a good entry bar today. Because they failed to get one, the best the bulls will probably get over the next few days is a 3 – 5 day trading range on the daily chart.
Less likely, the bulls will reverse today’s selling tomorrow, and then get several consecutive bull days. If so, the odds will again favor a test of the all-time high.
See the weekly update for a discussion of the price action on the weekly candlestick chart and for what to expect going into next week.
Traders can see the end of the day bar-by-bar price action report by signing up for free at BrooksPriceAction.com. I talk about the detailed S&P Emini futures price action real-time throughout the day in the BrooksPriceAction.com trading room. We offer a 2 day free trial.
When I mention time, it is USA Pacific Standard Time (the Emini day session opens at 6:30 am PST, and closes at 1:15 pm PST). You can read background information on the intraday market reports on the Intraday Market Update page.


