Emini ignoring Trump pulling out of Iran deal
I will update again at the end of the day
Pre-Open market analysis
By trading below Tuesday’s low on the daily chart, yesterday triggered a sell signal. Yet, Monday was a doji and therefore a weak sell signal. In addition, yesterday was a trading range day and consequently a weak entry bar. Furthermore, yesterday is a buy signal bar on the daily chart. The odds are that the 2 day selloff is a pullback after last week’s strong 2 day rally, and that this rally will continue at least up to the April 18 lower high of 2718.00.
Before traders believe that the bull trend is resuming, they want to see many bull bars on the daily chart, and 2 – 3 consecutive bull bars closing on their highs. Until then, there is still a 40% chance of a break below the February low.
Since the past 2 days were trading range days, there is an increased chance of a trading range day today. However, the context favors a rally to at least the April 18 high this week.
Overnight Emini Globex trading
The Emini is up 10 points in the Globex session. It therefore might gap above yesterday’s high. Since yesterday is a buy signal bar, that would trigger a daily buy signal. In addition, the Globex market is at last week’s high and last week is a buy signal bar on the weekly chart. Therefore, the Emini could trigger both a daily and weekly buy signal today. Moreover, the April 18 high is strong resistance and therefore a strong magnet above. Consequently, there is an increased chance of a bull trend day today.
If the bulls get a gap up, they will try to keep the gap open. Even if there is a test down to below yesterday’s high, which would close the gap, there is still an increased chance of an early low of the day. Less likely, the Emini will fail again at last week’s high and create a bear trend day.
Yesterday’s setups
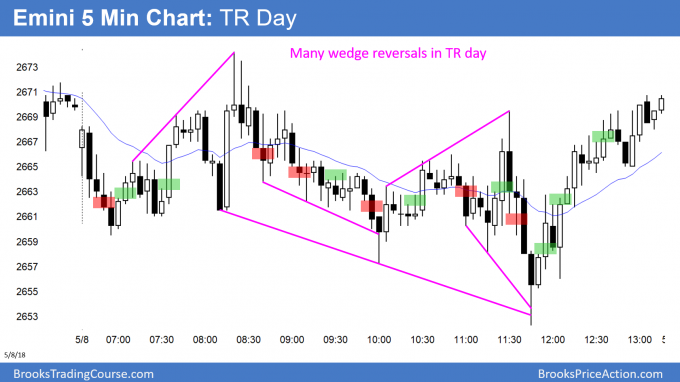
Here are several reasonable stop entry setups from yesterday. I sometimes also show limit order entries and entries on the close of bars.
EURUSD minor bottom after parabolic wedge sell climax
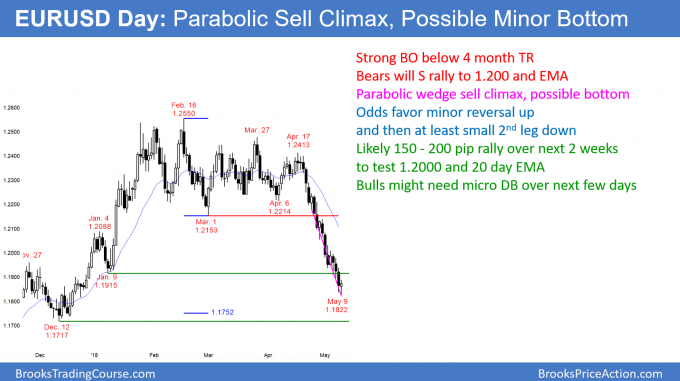
The EURUSD daily Forex chart has sold off in a parabolic wedge sell climax. Since today so far is a small reversal day, it might be a minor bottom.
The EURUSD daily Forex chart is in a strong bear trend. Since the selloff has had a series of big bear bars interrupted by bull bars, it is a parabolic wedge bear channel. This is a sell climax and it is now around support. Furthermore, it has had 4 small legs down.
Parabolic wedge sell climaxes typically bounce after 3 – 4 legs. Consequently, the bears will probably start to take profits and bulls will begin to buy for a bounce. Resistance above is the 1.2000 Big Round Number and the 20 day EMA. The odds are that there will be a 150 – 200 pip rally to this area over the next couple of weeks. Less likely, the 1st leg up will reach the March 1 low of 1.2153 at the bottom of the 4 month trading range.
The selling is so strong than many bulls will want at least a micro double bottom before they buy. However, they might not get it. Instead, the daily chart is so oversold that it might rally for about a week before there is a minor pullback for the bulls to buy.
The bears will look to sell again near resistance. This is because a reversal up from a sell climax is usually minor. That means that there is a 70% chance that there will be a test of the sell climax low before the bulls have a reasonable chance of a major reversal (into a bull trend).
Overnight EURUSD Forex trading
The EURUSD 5 minute Globex chart rallied 70 pips overnight. There is a 50% chance that this is the start of a reversal up to 1.2000. Therefore, the bulls will buy pullbacks. Day traders will look for 10 – 30 pip scalps. Traders will hold for a test of 1.2000.
Since this would be a minor reversal on the daily chart, day trading bears will sell rallies on the 5 minute chart for 10 – 30 pip scalps. However, if the rally continues, the bears will conclude that it will continue up to around 1.2000. They therefore will wait to swing trade until the rally reaches resistance above.
Summary of today’s S&P Emini futures price action and what to expect tomorrow
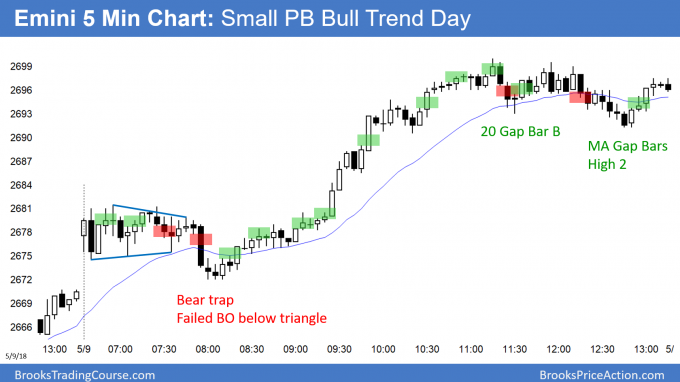
The Emini rallied in a small pullback bull trend. It stalled at the 2700 Big Round Number.
The Emini rallied in a small pullback bull trend, but stalled at the 2700 Big Round Number. It triggered daily and weekly buy signals by trading above yesterday’s and last week’s high. The bulls need follow-through buying over the next several days to make traders believe that this breakout will be successful. The next target is the April 2718.00 high. The bears need a strong reversal down, but the odds favor the bulls.
See the weekly update for a discussion of the price action on the weekly candlestick chart and for what to expect going into next week.
Traders can see the end of the day bar-by-bar price action report by signing up for free at BrooksPriceAction.com. I talk about the detailed S&P Emini futures price action real-time throughout the day in the BrooksPriceAction.com trading room. We offer a 2 day free trial.
When I mention time, it is USA Pacific Standard Time (the Emini day session opens at 6:30 am PST, and closes at 1:15 pm PST). You can read background information on the intraday market reports on the Intraday Market Update page.


