Trading Update: Monday May 1, 2023
S&P Emini pre-open market analysis
Emini daily chart
- The Emini formed two strong bull bars last week, reversing the past selloff ending on April 26th. However, the first reversal down likely to fail.
- The rally over the past two trading days is strong enough to likely lead to a second leg-up.
- Some bears sold the high of April 26th and scaled in higher. After last Thursday’s strong bear close, many of those bears began to exit shorts. However, some bears are still short and will use the first reversal down to buy back shorts at a reduced loss.
- There are bulls who are trapped out of a winning trade. The past two trading days were a big enough surprise, and those bulls were unprepared to buy. Since they are trapped out of a winning trade, they will use any pullback to enter a position at a lower price.
- At the moment, the odds favor a second leg up. This means that the market is Always In Long, and traders will look to buy for any reason betting on higher prices.
- At a minimum, the market will probably get above the February 2nd high and likely try and test 4,300.
- The bulls have done an excellent job over the past two trading days. However, they need to continue to impress traders. The market is still at the top of a trading range, and if the market begins to go sideway at resistance (February 2nd high), more and more traders will exit longs, and bears will start to establish shorts.
- Overall, the odds are that the market is probably going higher for at least a small second leg. The bears will need to undo the damage caused by the bulls before the bears have a chance at reversing the market.
Emini 5-minute chart and what to expect today
- Emini is down 8 points in the overnight Globex session.
- The overnight Globex session has been in a tight trading range on the 60-minute chart.
- The bulls want the rally to continue and today to become another intense bull trend day.
- More likely, today will disappoint the bulls as traders begin to take partial profits.
- This means that traders should be open to today becoming a trading range day or a possible bear trend day.
- Since the daily chart has had an intense two-day bull breakout, traders should be open to the possibility of today forming a weak bear trend (broad bear channel) and the bulls getting an upside breakout late in the day as buyers on the daily chart, try and enter at a lower price.
- As I often say, most traders should assume the open will have a lot of trading range price action. This means most traders should consider not trading for the day’s first 6-12 bars.
- Most traders should try and catch the opening swing trade that typically begins before the end of the second hour. It often forms after a double top/bottom or a wedge top/bottom.
Emini intraday market update
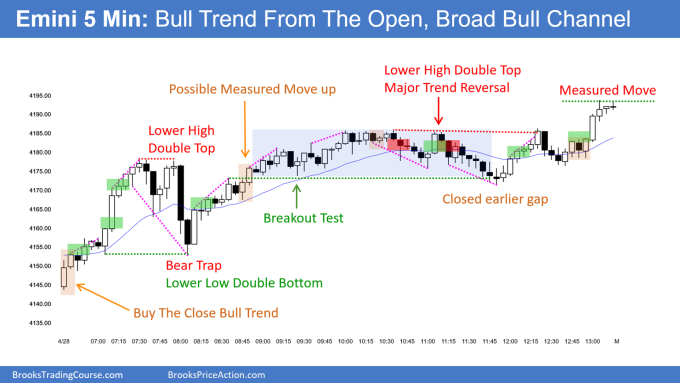
- The Emini had a small gap down on the open and rallied for two legs up to bar 18 (8:00 AM PT).
- The rally up to bar 18 had decent selling pressure, which increased the odds that it would be a complex leg in a trading range.
- The bears got a strong reversal down to bar 23 (8:25 AM PT). The bears got close to the open of the day. However, they failed to reach it. The bulls got an endless pullback after the bear breakout down to bar 23, and the market got a strong breakout with a follow-through on bar 31 (9:05 AM PT).
- As of bar 34 (9:15 MA PT), the market is Always In Long and trying to reach the day’s high.
- Even if the market gets to a new high, it will probably evolve into a trading range, which means there will likely be sellers not far above the bar 19 high of the day.
- Traders should expect the day to remain a trading range day. The bears will want to close the day below the day’s open. However, they will need to develop more selling pressure first. This means sideways to up is more likely unless the bears can get enough selling pressure to make the market go sideways.
Friday’s Emini setups

Al created the SP500 Emini charts.
Here are several reasonable stop entry setups from Friday. I show each buy entry with a green rectangle and each sell entry with a red rectangle. Buyers of both the Brooks Trading Course and Encyclopedia of Chart Patterns have access to a near 4-year library of more detailed explanations of swing trade setups (see Online Course/BTC Daily Setups). Encyclopedia members get current daily charts added to Encyclopedia.
My goal with these charts is to present an Always In perspective. If a trader was trying to be Always In or nearly Always In a position all day, and he was not currently in the market, these entries would be logical times for him to enter. These therefore are swing entries.
It is important to understand that most swing setups do not lead to swing trades. As soon as traders are disappointed, many exit. Those who exit prefer to get out with a small profit (scalp), but often have to exit with a small loss.
If the risk is too big for your account, you should wait for trades with less risk or trade an alternative market like the Micro Emini.
EURUSD Forex market trading strategies
EURUSD Forex daily chart

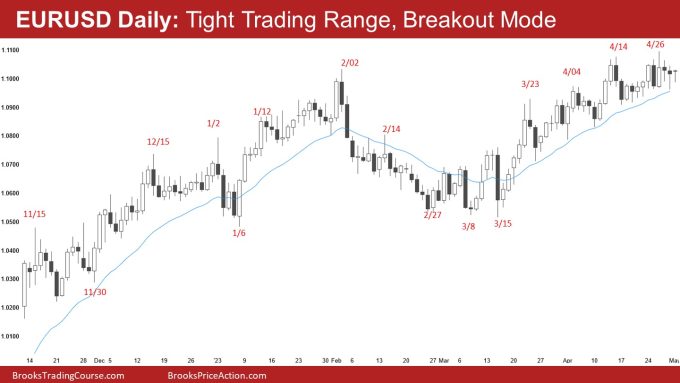
- The EURUSD continues to go sideways in a tight trading range holding above the moving average (blue line).
- The market is still Always In Long. However, the past five trading days have had a lot of overlapping bars. This increases the risk of more trading range price action.
- The bulls want the tight bull channel to continue up, and the bears want a downside breakout and test of prior lower highs, such as April 17th.
- The bears need to get a close below the moving average. Without it, traders will continue to buy at the moving average, betting it will act as support.
- At the moment, the odds are that the bull channel that began in March will convert into a trading range and test prior lower highs. However, without a downside breakout, the market will probably have to go sideways and develop more selling pressure.
Summary of today’s S&P Emini price action

Al created the SP500 Emini charts.
End of day video review
YouTube End of Day Emini Review and Q&A with Brad Wolff:
https://www.youtube.com/live/0MD-sxWXMVU?feature=share&t=52
See the weekly update for a discussion of the price action on the weekly chart and for what to expect going into next week.
Trading Room
Al Brooks and other presenters talk about the detailed Emini price action real-time each day in the BrooksPriceAction.com trading room days. We offer a 2 day free trial.
Charts use Pacific Time
When times are mentioned, it is USA Pacific Time. The Emini day session charts begin at 6:30 am PT and end at 1:15 pm PT which is 15 minutes after the NYSE closes. You can read background information on the market reports on the Market Update page.

