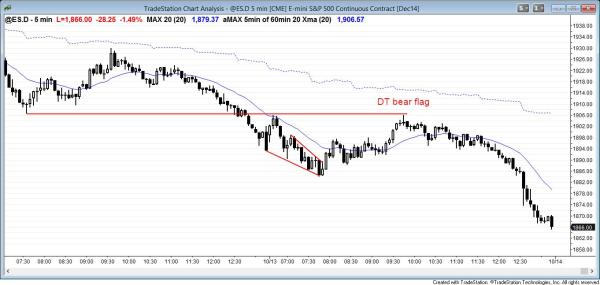
End of day comments about today’s Emini price action and day trading: strong follow-through selling

The Emini had early follow-through selling after yesterday’s strong bear breakout, but it reversed up after the first hour. However, there was a strong selloff into the close and this resulted in a doji candle on the daily chart.
The Emini had an early selloff, but many bear bars were followed by bull bars and this was trading range behavior. As expected after a big sell climax like yesterday, there was a two legged rally that lasted at least 20 bars. The day was a trading range day until the final 90 minutes. The bulls wanted a bull body on the daily chart to increase the chances that Friday’s selling was part of a trading range. The bears wanted a big bear trend bar to confirm yesterday’s strong bear breakout and increase the chances of a bear trend on the daily chart. The bears won. This is very bearish on the daily chart and the first reversal up will probably be sold.
S&P500 Emini intraday market update for price action day traders: trading range likely for day trading after initial selling subsides
Posted 7:33 a.m.
Bear trends often have early rallies that form the high of the day (an opening reversal down from a resistance level), but if today is instead a trading range day, that attempt at bear trend resumption will fail.
During today’s initial bear trend, there was bad follow-through after many bear trend bars. This is more common in bear legs within trading ranges than within bear trends. Yesterday’s sell climax and today’s early buying pressure make a trading range likely for day trading after the initial selling subsides. The bulls are hoping for a wedge bottom, but there is no bottom in place yet and the Emini is still in a bear trend.
Yesterday (in trading terms, but actually Friday) was a sell climax, so there is about a 70% chance of a rally lasting at least 2 hours at some point today. This means that an early trading range is likely. However, there is often some initial follow-through selling on the open before that rally develops. Until there is a strong breakout up or down, with follow-through, the swings up and down will probably be part of a big trading range. Since the bars and swings have been so big, traders need to trade small.
Before the open comments on S&P500 Emini 60 minute, daily, weekly, and monthly candle charts: Testing the August low for a possible double bottom
At the end of Friday, the 60 minute chart had the strongest consecutive bear trend bars in about 100 bars. This could be an exhaustive sell climax.
The Emini has been in a trading range for 4 months and Friday tested the bottom of the range, which is the August low. The bulls want a double bottom on the daily and weekly charts. The bears had a very strong breakout on the daily chart on Friday, but they need follow-through selling. Since the Emini is in a trading range and traders are therefore constantly disappointed, Friday’s big bear breakout is probably going to have disappointing follow-through today. This means that today will probably not be a big bear trend day and it might even be a bull reversal day. Given how strong Friday’s bear breakout was, even if the Emini reverses back up, it will probably have to test Friday’s low within the next 10 bars or so. This means that there are probably sellers above and the first rally on the daily chart will probably be sold.
Markets constantly evolve and at some point bear trends develop. It is possible that Friday’s selloff is the start of a bear trend. If today does in fact become a big bear trend day, then this would confirm Friday’s selloff and it would increase the chances that Friday and today will form a measuring gap on the daily chart. It would also increase the chance that the Emini is working its way down to the monthly moving average, which is around 1800. Trends often have strong closes in the direction of the trend. If the daily chart is in a bear, there will be many days that look like trading range days until the final hour, but then have a strong selloff into the close. This will remind traders that any strength by the bulls earlier in the day was temporary and that the bears actually are in control.
See the weekly update for a discussion of the weekly chart.
Traders can see the end of the day bar-by-bar price action report by signing up for free at BrooksPriceAction.com. I talk about the detailed Emini price action real-time throughout the day in the BrooksPriceAction.com trading room, and a 2 day free trial is available.
When I mention time, it is USA Pacific Standard Time (the Emini day session opens at 6:30 am PST, and closes at 1:15 pm PST). You can read background information on the intraday market reports on the Intraday Market Update page.

