Emini daily double top and weekly bull flag
Updated 6:55 a.m.
The Emini opened with a big gap down and a pair of bear bars. Because the open is so far below the average price, many bears will wait to sell a rally or trading range that is closer to the moving average. While the Emini opened Always In Short, the Emini usually goes mostly sideways for the 1st hour or two after a big gap down. If so, the bears will try for trend resumption down later in the day.
The bulls see that the gap down was not below the September low. While the context favors the bears, the bears are not yet strong enough to make the bulls give up. These bulls will look for a reversal up. Their 1st objective is to stop the selling. If they succeed, they will then try for a major trend reversal, or a strong reversal up. Unless they get a strong bull breakout, the odds of a strong bull trend day are small.
Because the gap down has already lowered the price a lot, the bears might not get a huge bear trend day either. The odds are that today will end up as a bear trend day, but it might be a weaker type of trend day. If the bears are strong, they will try to get a Sell The Close selloff in the final 30 minutes.
Today is Friday so weekly support and resistance are important. The bears want today to close below last week’s low. That would create an outside down day on the weekly chart, which is a sign of strong bears.
Pre-Open Market Analysis
The Emini was again in a trading range yesterday, as it has been for most days over the past 2 months. The odds are that this will continue until there is a breakout up or down.
Nothing has changed from what I have been saying for months except that the odds no longer favor a new high before the 100 point correction. The odds are now about 50%.
Whether or not there is a new high this month, there is a 60% chance that the Emini will close the gap above the 2 year trading range. Therefore, the Emini will probably have about a 100 point pullback before it gets much above the measured move targets above.
Emini Globex session
The Emini sold off yesterday and the selling continued overnight. Today will probably gap down. Since the context is good for a reversal, a gap down could be a break away gap and the start of a bear trend on the daily chart. Yet, the Emini is still above the September low and above the August trading range low. Bulls will buy the gap down open, expecting it to fail. Yet, the risk is great for the bulls.
The bears will sell the gap down open and any rally near yesterday’s low. If they are able to keep the gap open for 3 or more days, the odds begin to get better than 50% that the 100 point selloff has begin.
Until there is a breakout, there is no breakout. The bears need a close below these two support areas, as well as below the July trading range. If they get that, the bears would then have a 60% chance of continuing the selloff below the top of the 2 year trading range around 2100.
Bond market top
The 30 year bond futures yesterday closed below the low of a 2 month trading range on the daily chart. This followed a nested wedge top on the monthly chart. Therefore, the bond market might be putting in a major top on the monthly chart. Hence, it could be the top for decades to come.
If interest rates go up, investors will have an alternative to stocks. Many will therefore move money from stocks to bonds. As a result, the stock market could sell off.
The bond market often tops out months before the stock market when there is a major reversal. Traders are never certain that a reversal is not just a pullback until the market has fallen far. That will probably be the case with both bonds and stocks.
Forex: Best trading strategies
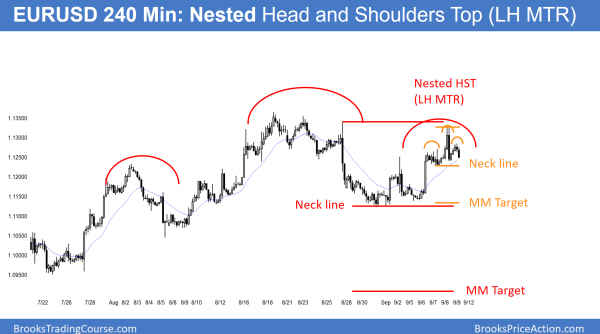
The 240 minute chart is turning down from a small Head and Shoulders Top, which is the right shoulder of a larger Head and Shoulders Top. The entire pattern is the right shoulder of an even larger Head and Shoulders Bear Flag on the daily chart.
The 240 minute EURUSD chart reversed down yesterday from below the August 26 sell climax high. Furthermore, the September rally is a wedge. This increases the chances of at least a couple small legs sideways to down.
As a result of yesterday’s rally getting close to the target, but not quite reaching it, it might have to get closer before it can fall much. The magnetic pull of resistance usually continues until the rally gets there or gets very close. Yesterday did not get close enough. Yet, it did not reverse down so much as to make bulls give up. The odds favor at least a bounce today.
Head and Shoulders Top on 240 minute chart
The bears see the September rally on the 240 minute chart as the right shoulder of a Head and Shoulders top. The left shoulder contains a smaller Head and Shoulders Top. The entire pattern is nested in a larger Head and Shoulders Bear Flag on the daily chart. The left shoulder is the February rally. While typically only 40% of major reversals lead to reversals, the odds are closer to 50% here because of the nesting on 3 time frames. The alternative is usually a trading range, or, less likely, a bull flag and rally.
The EURUSD Forex market is testing the neck line of the smallest Head and Shoulders Top. The bears need a strong breakout. If they get it, the target is a measured move down. That is around the neck line of the next larger top. The bulls will buy at the neck line because that is buying low in a trading range. Because of the nested pattern, they will be less willing to buy. Hence, the probability of a reversal up is only 50%, rather than the usual 60%.
Summary of today’s S&P Emini futures price action and what to expect tomorrow
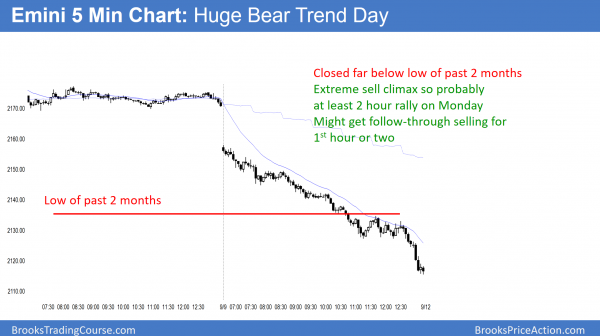
The Emini had a big bear trend today and closed below the lows of about 50 bars.
Today was a big bear trend day, and the context was good for the bears. While today’s sell climax might lead to a rally on Monday, there is a 70% chance of a drop below the top of the 2 year trading range within the next week or so, and possibly on Monday.
See the weekly update for a discussion of the price action on the weekly candlestick chart and for what to expect going into next week.
Traders can see the end of the day bar-by-bar price action report by signing up for free at BrooksPriceAction.com. I talk about the detailed S&P Emini futures price action real-time throughout the day in the BrooksPriceAction.com trading room. We offer a 2 day free trial.
When I mention time, it is USA Pacific Standard Time (the Emini day session opens at 6:30 am PST, and closes at 1:15 pm PST). You can read background information on the intraday market reports on the Intraday Market Update page.


