Emini buy climax going into earning October season
Updated 6:48 a.m.
The Emini began with a doji at yesterday’s close. This is a continuation of yesterday’s 70 bar tight trading range. The bears want a wedge lower high after yesterday’s initial selloff. They then want a bear break below the wedge bull channel and a 2nd leg down. The bulls want the 70 bar bull channel to continue to a new high.
This early continuation of yesterday’s tight trading range trading is making most traders wait for a breakout up or down. Since the Emini has been sideways for 4 days, the odds favor another trading range day today. The Emini is now deciding on the direction of the 1st swing. The odds are that it will reverse after 1 – 3 hours and have an opposite swing. This quiet open and the 4 sideways days reduce the chance for a strong trend day.
Pre-Open market analysis
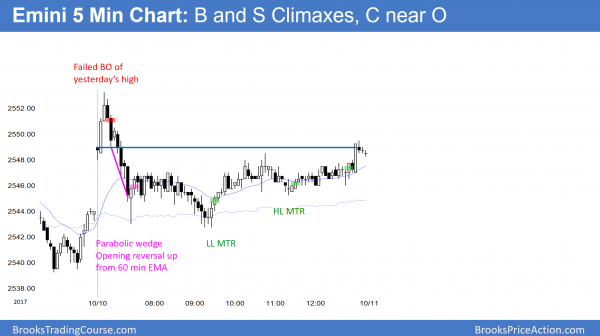
The Emini reversed down from an all-time high yesterday, but reversed up from above the low of the day before. It was mostly a trading range day. While there are measured move targets above and the momentum up is strong on the daily chart, the buy climaxes on the weekly and monthly charts are extreme. This means that the odds of much higher prices without a pullback are not high. Yet, because the bull trends are so strong, any reversal down will become a bull flag.
The Emini is currently probing higher in a search for the top of the buy climax. There is no tip yet, but it probably is not much higher. Since most recent days have been mostly sideways, today will also be mostly a trading range day.
Overnight Emini Globex trading
The Emini is down 2 points in the Globex market. Because it is in a 4 day tight trading range, the odds favor another trading range day. However, the momentum up is strong on the daily chart and there are measured move targets just above a 2559.50 and 2577.50. In addition, there is no clear top yet. Therefore, the odds favor at least another week or two of sideways to up trading before the bears will again try to create a 100- 200 point pullback.
Since a strong breakout above the resistance without 1st getting a 100+ point pullback is unlikely, any rally over the next 2 weeks will probably lack consecutive big bull trend days.
Yesterday’s setups
Here are several reasonable stop entry setups from yesterday. I sometimes also show limit order entries and entries on the close of bars.
EURUSD Forex market trading strategies
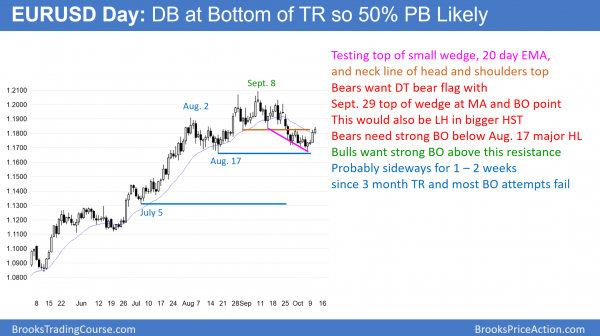
The EURUSD Forex chart rallied from a double bottom with the August 17 low. It is now testing the resistance at the neck line of the head and shoulders top (the breakout point), the 20 day exponential moving average, and the beginning of the small wedge bottom.
The EURUSD daily Forex chart has been in a trading range for 3 months. All trading ranges always have reasonable buy and sell setups. The bulls see a slightly higher low in a bull trend. They see the reversal up as a double bottom with the August 17 low. Yet, need a strong breakout above the top of the range before traders will conclude that the 10 month bull trend is resuming. In addition, on the monthly chart, this see a 3 month bull flag that is testing the top of the 2 year trading range.
The bears see the 10 month rally as a pullback to the breakout below a 10 year trending range. On the daily chart, they see the 4 day rally as a pullback to the bottom of the September trading range. They expect this to be simply a test of the breakout point and for the rally to fail at this resistance. If they get a reversal down, this rally would become a right shoulder in a bigger head and shoulders top. The entire 3 month trading range is the top. However, they need a strong break below the double bottom before traders begin to look for a measured move down. That is also around the July 5 low, which is the next lower major higher low.
Overnight EURUSD Forex trading
The 5 minute chart has been in a 40 pip range overnight. Since the bulls achieved their minimum objective of testing resistance, many are taking profits. In addition, bears are beginning to sell. Since the chart is in a 3 month trading range, traders are quick to take profits up and down. Therefore, the odds favor a pause here for a few days. There is room to the middle of the 3 month range, and trading range rallies usually extend beyond the midpoint. Therefore, even if the bears get a selloff for a couple days over the next week, the odds still favor at least a little more rally.
Because the 4 day rally is not breaking strongly above resistance, it will probably evolve into a 2 – 3 day trading range. Wedge bottoms typically have 2 legs up. The wedge was small, so there will probably be a small pullback and then a 2nd leg up over the next weeks.
Summary of today’s S&P Emini futures price action and what to expect tomorrow
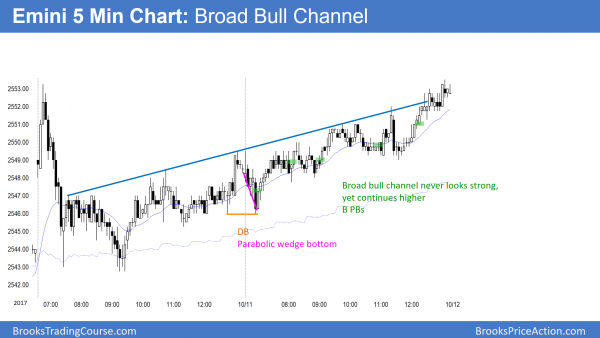
Today continued yesterday’s weak rally in a broad bull channel. Bulls bought pullbacks.
While today was a small day, it closed near its high and was therefore a bull trend day. In addition, there are measured move targets not far above. Furthermore, broad bull channels often last 3 or more days. Finally, they have a 40% chance of a successful breakout, unlike channels of shorter duration, which have only a 25% chance. However, because of the 4 day tight trading range, the odds of a strong bull trend day tomorrow are less. Also, the bears will look for a reversal down from a double top with yesterday’s high.
See the weekly update for a discussion of the price action on the weekly candlestick chart and for what to expect going into next week.
Traders can see the end of the day bar-by-bar price action report by signing up for free at BrooksPriceAction.com. I talk about the detailed S&P Emini futures price action real-time throughout the day in the BrooksPriceAction.com trading room. We offer a 2 day free trial.
When I mention time, it is USA Pacific Standard Time (the Emini day session opens at 6:30 am PST, and closes at 1:15 pm PST). You can read background information on the intraday market reports on the Intraday Market Update page.


