Trading Update: Friday September 2, 2022
Emini pre-open market analysis
Emini daily chart
- The bears began taking partial profits yesterday, and the bulls started to buy for scalps. Bulls want strong entry bar today. The market reached the July 8 breakout point where there were buyers.
- Most breakout points are eventually tested; this is because most breakout points lead to a breakout, and will ultimately evolve into a trading range, and the market will retest it. The reason I am bringing this up is because bull breakout points (can also call them breakout gaps) can often lead to support and a small bounce.
- The market also tested the bottom of the bull channel that started on July 26. The beginning of a channel is usually the start of a developing trading range, so it is a logical place for the market to test.
- The bulls have a good buy signal bar, but it is in a 5-bar bear micro channel, so there will probably be sellers above. The bulls are in the good buy zone, but they will probably need some micro double bottom before traders are eager to buy.
- It’s possible the bulls can get 2-3 consecutive strong bull bars here, and the market becomes always long, but even then, the problem the bulls will have, is they would likely need a test of the September low for this to be a credible bottom. It is the same logic as how the market will often form a higher low major trend reversal but later will have to retest that higher low, and form a double bottom major trend reversal.
- The overall point I am trying to make is that even if the bulls get a bull breakout to the 4,050 area, it will likely be minor and the market will have to test back down to the September low.
- The bears see a 4-bar bear breakout down to August 31 and want a channel down to the June lows. This would be a low probability event, though, as the odds favor a bottom higher low and sideways to up.
- The most important thing to remember is that the market is in a trading range, which means that the bears will likely be disappointed here, and the bulls will likely be disappointed after any rally we get. Overall, this means that the market is probably going sideways.
Emini 5-minute chart and what to expect today
- Emini is up 35 points in the overnight Globex session.
- The market got an upside breakout on the 5:30am PT employment report, so the market will gap up.
- As always, the odds favor a trading range open which means a limit order market.
- Traders should consider waiting for 6-12 bars before placing a trade.
- Traders can wait for a credible bottom or top, such as a wedge bottom/top or a double bottom/top.
- Lastly, traders can wait for a clear breakout with follow-through before trading.
- Most important thing on the open is to be patient. A reasonable trade will eventually develop, and it is important not to take too many losses before then.
- Today is Friday, so traders should be open to a sudden late breakout in the final 1-2 hours of the day. Friday can often lead to big moves late, so traders should be aware.
Yesterday’s Emini setups

Al created the SP500 Emini charts.
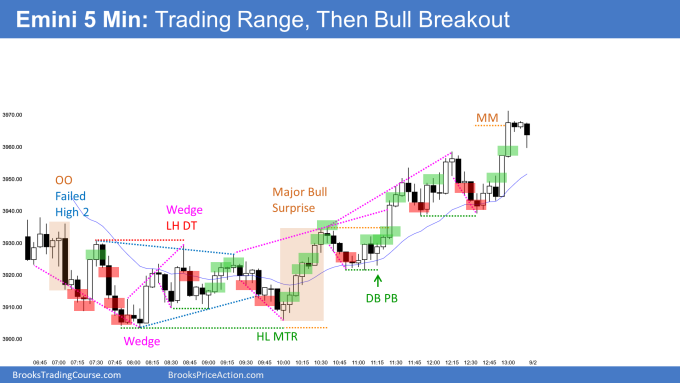
Here are several reasonable stop entry setups from yesterday. I show each buy entry with a green rectangle and each sell entry with a red rectangle. Buyers of both the Brooks Trading Course and Encyclopedia of Chart Patterns have access to a much more detailed explanation of the swing trades for each day (see Online Course/BTC Daily Setups).
My goal with these charts is to present an Always In perspective. If a trader was trying to be Always In or nearly Always In a position all day, and he was not currently in the market, these entries would be logical times for him to enter. These therefore are swing entries.
It is important to understand that most swing setups do not lead to swing trades. As soon as traders are disappointed, many exit. Those who exit prefer to get out with a small profit (scalp), but often have to exit with a small loss.
If the risk is too big for your account, you should wait for trades with less risk or trade an alternative market like the Micro Emini.
EURUSD Forex market trading strategies
EURUSD Forex daily chart

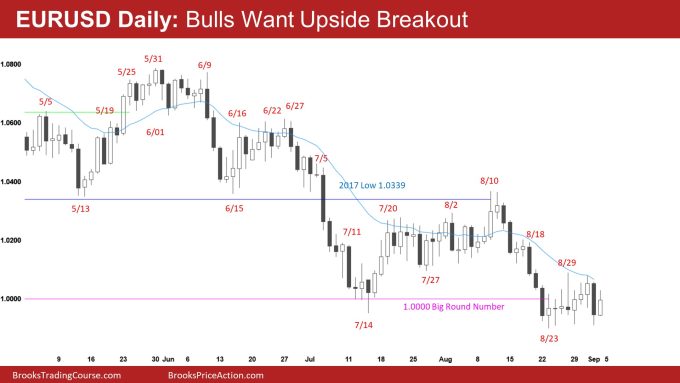
- The bears tried to form a credible wedge bear flag with yesterday being a bear inside bar, but they failed and yesterday’s bar got too big, making it a weaker sell.
- The bulls want an upside breakout here and a measuring move up of the past two-week trading range.
- The market is trying to bottom at the 1.000 big round number and is beginning to develop good buying pressure, which is good for the bulls.
- Overall, the market will probably go sideways to up soon, and the market will test the middle of the July – August trading range soon.
Summary of today’s S&P Emini futures price action and what to expect tomorrow

Al created the SP500 Emini charts.
End of day review
- Out of town traveling, so no videos for now but more to come soon.
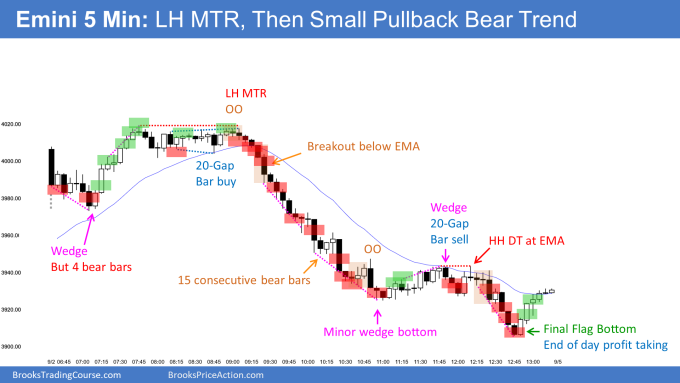
- Today opened with a gap up, and bar 1 was a big bear bar closing on its low. While the bars were big the odds favored sellers above and at least a second leg down.
- The bull bar on bar 2 warned that the market would probably go sideways than straight down.
- The bulls got a wedge bottom around 7:00 PT that was a reasonable buy, betting on a swing and temporary low of the day.
- Remember, I often say in the blog that traders should look for double bottom/tops and wedge bottom/tops. They can often lead to great swing trades where a trader can get 2x their risk like today.
- The problem with the wedge at 7:00 PT was that it was part of a 4-bar bear microchannel that increased the odds of sideways instead of straight up.
- The rally up to 7:30 was good for the bulls, but the breakout bars were not uniform (same size). It was a small spike and channel up to 7:30 (wedge top) on a smaller time frame.
- Also, bar 1 might have caused enough damage to the bull case that odds favored sellers above bar 1 and sideways instead of a bull trend day.
- The market was Always in long at 7:30, but it went sideways until 9:00 and formed a lower high major trend reversal that led to a strong selloff.
- Again, as I said above, today was Friday, so traders needed to be open to crazy swings like what happened today.
- Also, it is worth noting that there was a microchannel on the daily chart, so the odds favor sellers above, which is in part why the market went outside down today.
- When you get a selloff like 9:30, it is selling the close for any reason. If you cannot decide, just sell a small 20% position size and use the correct stop but sell something to ensure you are in the market. The channel down was so tight that traders were selling above and below anything. The most important thing is to use the correct stop and trade small.
- By 11:00, the market had consecutive sell climaxes, and the odds favored a pullback. The bulls tried for a major trend reversal, but they ran out of time, and the market sold off to a new low of the day and had profit taking into the close.
See the weekly update for a discussion of the price action on the weekly chart and for what to expect going into next week.
Trading Room
Traders can see the end of the day bar-by-bar price action report by signing up for free at BrooksPriceAction.com. Al talks about the detailed S&P Emini futures price action real-time throughout the day in the BrooksPriceAction.com on trading room days. We offer a 2 day free trial.
Charts use Pacific Time
When times are mentioned, it is USA Pacific Time. The Emini day session charts begin at 6:30 am PT and end at 1:15 pm PT which is 15 minutes after the NYSE closes. You can read background information on the market reports on the Market Update page.

