Trading Update: Thursday July 20, 2023
S&P Emini pre-open market analysis
Emini daily chart
- The Emini is beginning to stall at the 4,600 big round number and will probably pull back for a day or two.
- The market reached 4,600 yesterday. However, the day was mostly a trading range day. This is a sign that the momentum is drying up, at least temporarily.
- The Emini will probably pull back for a few days and, at a minimum, go sideways.
- The bears are hopeful that they can damage the bull rally. They need a strong enough downside breakout that the odds will favor a second leg down.
- Overall, the upside is probably limited over the next several weeks, and the market will likely have to pullback before the bulls have a credible chance at getting higher prices.
Emini 5-minute chart and what to expect today
- The overnight Globex market has gone sideways for most of the overnight session.
- The market is likely getting neutral going into the Initial jobless claims report at 5:30 AM PT which will probably move the market.
- Traders should expect a trading range open during the U.S. Session. This means traders should consider waiting for the first 6-12 bars before placing a trade unless they are comfortable with limit order trading.
- Traders should pay attention to the open of the day since the market will probably be in a trading range.
- Traders should be mindful that the market might close below the day’s open due to the daily chart becoming climactic. If the market is above the open and the rally is not strong, traders should be prepared for a selloff back to the open.
- Overall, traders should be prepared for a trading range day. However, they must remember that price is truth. This means one can never be in denial of the chart and must trade the chart in front of them.
Emini intraday market update
- The emini rallied for the first 4 bars of the day.
- The rally on the open was big, and that increased the odds that today would not be a bear-trend day.
- The bears got a strong reversal down to bar 14; however, because of the buying pressure on the open, it was reasonable to assume that the market would test back to the open of the day.
- The low is probably in for the next 1-2 hours after the rally up to bar 17. The bulls will probably get a second leg up to the open of the day.
- The high of the day is probably too far away, so the upside is probably limited. Traders have to be prepared that bar 17 low was a possible sell vacuum which means the market could rally back up to bar 5 low. In order to short, better to wait for more selling pressure.
Yesterday’s Emini setups

Al created the SP500 Emini charts.
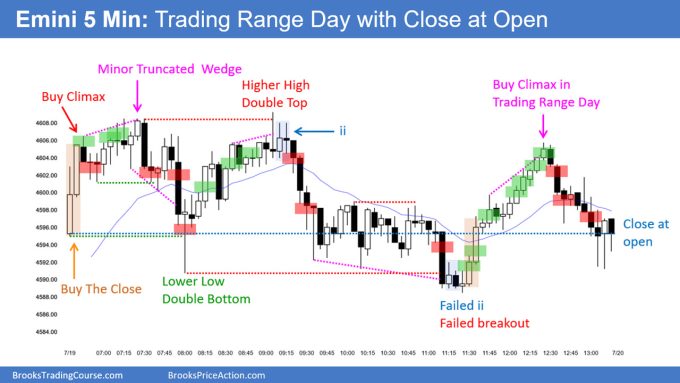
Here are several reasonable stop entry setups from yesterday. I show each buy entry with a green rectangle and each sell entry with a red rectangle. Buyers of both the Brooks Trading Course and Encyclopedia of Chart Patterns have access to a near 4-year library of more detailed explanations of swing trade setups (see Online Course/BTC Daily Setups). Encyclopedia members get current daily charts added to Encyclopedia.
My goal with these charts is to present an Always In perspective. If a trader was trying to be Always In or nearly Always In a position all day, and he was not currently in the market, these entries would be logical times for him to enter. These therefore are swing entries.
It is important to understand that most swing setups do not lead to swing trades. As soon as traders are disappointed, many exit. Those who exit prefer to get out with a small profit (scalp), but often have to exit with a small loss.
If the risk is too big for your account, you should wait for trades with less risk or trade an alternative market like the Micro Emini.
EURUSD Forex market trading strategies
EURUSD Forex daily chart

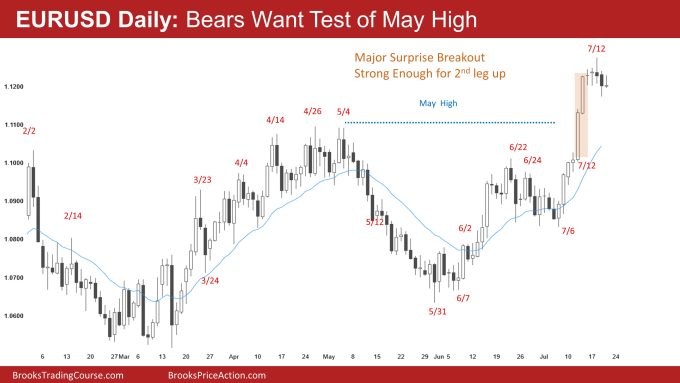
- The EURUSD is deciding on getting the second leg up after last week’s breakout or if the market has to test down to the May high first.
- The breakout last week is strong enough that the odds favor a second leg up. However, the breakout is also climactic, increasing the odds of a pullback.
- The consecutive bear’s bars over the past two days might be strong enough that there are sellers above yesterday’s (July 19th) high leading to a small second leg down.
- The bears are hopeful that last week’s bull breakout is a second leg trap. While this is possible, the odds are against it unless the bears can develop more selling pressure.
- Overall, the odds favor higher prices, and the best the bears can get is sideways.
Summary of today’s S&P Emini price action

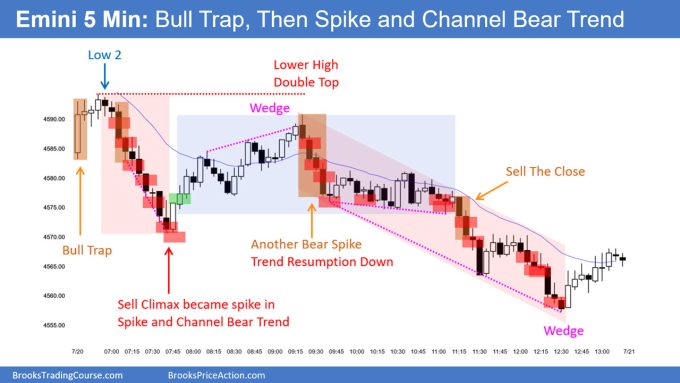
Al created the SP500 Emini charts.
End of day video review
Here is YouTube link if video popup blocked:
Emini End of Day Review – Thursday July 20, 2023 – Brad Wolff
See the weekly update for a discussion of the price action on the weekly chart and for what to expect going into next week.
Trading Room
Al Brooks and other presenters talk about the detailed Emini price action real-time each day in the BrooksPriceAction.com trading room days. We offer a 2 day free trial.
Charts use Pacific Time
When times are mentioned, it is USA Pacific Time. The Emini day session charts begin at 6:30 am PT and end at 1:15 pm PT which is 15 minutes after the NYSE closes. You can read background information on the market reports on the Market Update page.

