Trading Update: Thursday April 6, 2023
S&P Emini pre-open market analysis
Emini daily chart
- The Emini sold off over the past two trading days as bulls began to take partial profits. Bears want to close breakout point gap.
- The market may have to test closer to the March 22nd high, a breakout point. The bulls want to trap the bears and for the market to rally for a measured move (March 13th low to the March 22nd high), projecting up to around 4,300.
- Since the market is in a trading range, the market will probably close the March 22nd breakout point high and allow the limit order to bear out of the losing trade.
- The March 31st bull breakout bar was climactic, which increased the risk of the market getting a pullback soon, which has happened over the past two days. Even if the market gets below the March 31st low, there are likely buyers below.
- The bulls will see yesterday as a high 1 buy setup. They want today to trigger the buy above yesterday’s high and rally as a strong bull trend day.
- The problem the bulls have is that yesterday is a high 1 buy setup after a climactic rally, which increases the risk of a deeper pullback. This means that there may be more sellers than yesterday. The bears who sold above yesterday are not expecting a bear trend but rather a scalp.
- Ultimately, the bulls need a strong breakout above the February 2nd high. The longer the market goes sideways below the February 2nd high, the more traders will believe that the market is in a trading range. Strong trends do not stall just under important resistance, which is what is happening right now. This is a sign that the market is still in a trading range.
- Overall, the bulls hope the market is in a small pullback rally from the March 13th low. However, the longer the market goes sideways, the more traders will become convinced that the market is in a trading range, not a bull trend.
Emini 5-minute chart and what to expect today
- Emini is 10 points down points in the overnight Globex session.
- The market has been going sideways for most of the overnight session.
- Today will likely have a lot of trading range price action. Traders expect a one to two-day brief selloff on the daily chart, but that might be all the bears get.
- As I often say, most traders should assume today will have a lot of trading range price action until proven different.
- Traders should expect the first 6-12 bar to have a lot of limit order trading. If the market gets a strong breakout with follow-through, closing beyond support/resistance, traders can shift their thinking to trend trading.
- If today is going to be a strong trend day, there will be plenty of time to enter the trend’s direction.
- Traders should assume today will be a trading range day. This means that traders should look to sell any rally with two or three legs up, testing resistance. The opposite goes for looking to buy at the bottom of the trading range.
- Overall, most traders should be patient on the open and assume today will have a lot of trading range price action.
Emini intraday market update
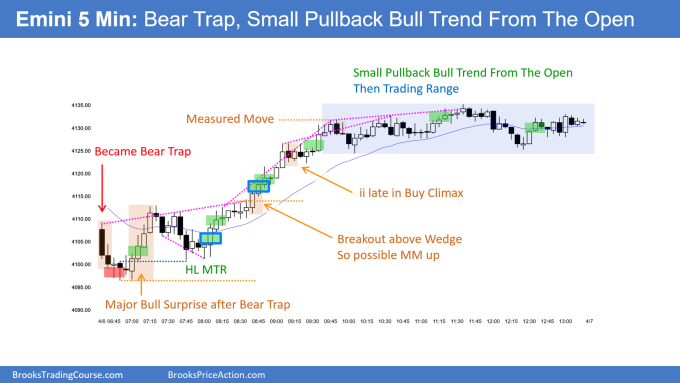
- The gapped down and broke below yesterday’s lower and reversed up.
- When bar 1 is a big bear trend bar near support, it is important to pay close attention to the follow-through. Bar 1 is climactic and will cause traders to scalp out.
- Bar 6 confirmed that the breakout below yesterday’s low was likely going to fail.
- The market became Always In Long by 7:10 AM PT; however, the pullback may be deep because of the initial selloff on the open. This is why the market had such a deep pullback down to bar 18 (8:00 AM PT). There were trapped bears who sold above bar 6 and scaled in higher. They were so disappointed by the rally that most of them got out of the trade break-even during the selloff to bar 18.
- As of 8:55 AM PT, the Bulls have had a very strong second leg up. The channel up is tight, which means the best the bears can probably expect is sideways for the next couple of hours.
- Overall, the bulls want to close on their high today and form a strong buy signal bar on the daily chart.
- With the rally up to 9:00 AM PT being climactic, most traders should wait for a couple of legs sideways to down before looking to buy. Since the channel up is so tight, most traders should wait to sell before more selling pressure develops. Bulls will probably be willing to scale in lower, which reduces the odds of the market getting a deep pullback.
Yesterday’s Emini setups

Al created the SP500 Emini charts.
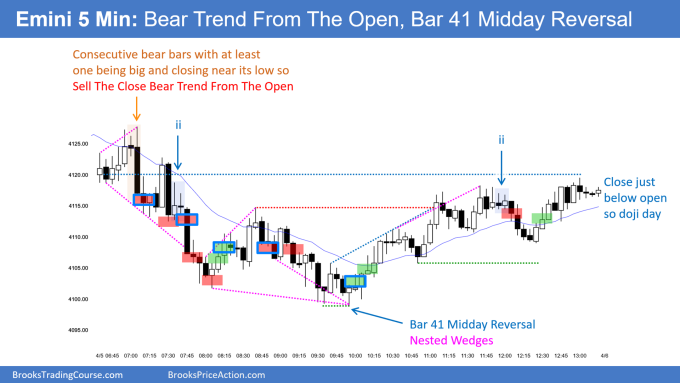
Here are several reasonable stop entry setups from yesterday. I show each buy entry with a green rectangle and each sell entry with a red rectangle. Buyers of both the Brooks Trading Course and Encyclopedia of Chart Patterns have access to a near 4-year library of more detailed explanations of swing trade setups (see Online Course/BTC Daily Setups). Encyclopedia members get current daily charts added to Encyclopedia.
My goal with these charts is to present an Always In perspective. If a trader was trying to be Always In or nearly Always In a position all day, and he was not currently in the market, these entries would be logical times for him to enter. These therefore are swing entries.
It is important to understand that most swing setups do not lead to swing trades. As soon as traders are disappointed, many exit. Those who exit prefer to get out with a small profit (scalp), but often have to exit with a small loss.
If the risk is too big for your account, you should wait for trades with less risk or trade an alternative market like the Micro Emini.
EURUSD Forex market trading strategies
EURUSD Forex daily chart

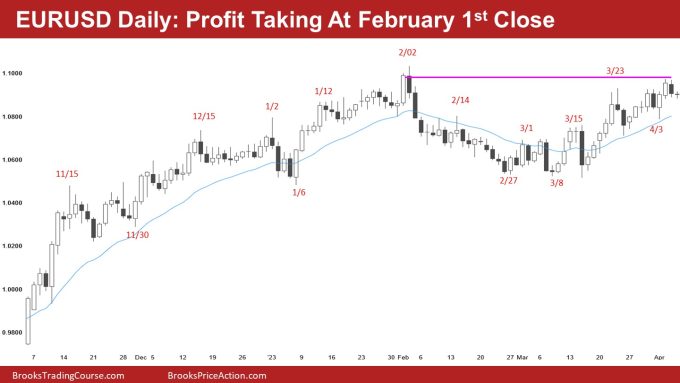
- The EURUSD sold off yesterday as traders began to sell on the test of the February 1st close.
- There were scale-in bulls who bought the February 1st close, and they bought lower. These bulls were likely so disappointed by the pullback to the March low that most of them would be happy to sell out of longs at their original entry.
- The bears knew the bulls would be disappointed, and they also added to yesterday’s selling.
- The bears hope that yesterday is a lower high major trend reversal. However, the channel up from the March low is tight. This will lower the probability for the bears.
- Overall, traders should assume that the market will go mostly sideways.
Summary of today’s S&P Emini futures price action

Al created the SP500 Emini charts.
End of day video review
- Live stream video — click link below to view on YouTube:
Emini End of Day Review – Thursday April 6, 2023
See the weekly update for a discussion of the price action on the weekly chart and for what to expect going into next week.
Trading Room
Al Brooks and other presenters talk about the detailed Emini price action real-time each day in the BrooksPriceAction.com trading room days. We offer a 2 day free trial.
Charts use Pacific Time
When times are mentioned, it is USA Pacific Time. The Emini day session charts begin at 6:30 am PT and end at 1:15 pm PT which is 15 minutes after the NYSE closes. You can read background information on the market reports on the Market Update page.

