Emini 5% summer correction as the Fed raises rates
Updated 6:42 a.m.
Today opened in the middle of yesterday’s range. In addition, the 1st bar was a doji bar. Yesterday was a bear channel and therefore today is likely to have a lot of trading range price action. This open is consistent with a trading range day.
Since yesterday was a big day and today opened in the middle, today could be an inside day. Therefore yesterday’s high and low are magnets. Furthermore, a break beyond either probably will not get far.
After 5 consecutive bear bars on the daily chart and with today’s neutral open, the odds are that today will close above its open. In conclusion, today will probably be mostly a trading range day. In addition, it will probably close above the open
Pre-Open market analysis
The Emini was in a trading range day yesterday, but closed near its low. The daily chart now has 10 bear bars in the past 12 days. While the Emini is still in its trading range, this is strong selling pressure. It therefore increases the chances of a bear breakout.
Furthermore, the buy climax on the weekly chart is extreme. The odds are that the Emini is in the process of correcting down to below the weekly moving average.
Overnight Emini Globex trading
The Emini was in a tight trading range until the Unemployment report this morning. While it rallied 7 points on the report, it quickly pulled back 4 points. Since yesterday was a bear channel, it was a bull flag. Hence, the odds favor a bull breakout above the channel and then a trading range today.
While it is possible that today could totally reverse yesterday’s selloff, the 8 bear days in the past 10 days make lower prices likely within a week. In addition, June was a sell signal bar on the monthly chart. In addition, the monthly chart has a parabolic wedge. Finally, the June low is only about 15 points below. Therefore, the odds favor a break below the June low within a week.
Yesterday’s setups
Here are several reasonable stop entry setups from yesterday.
EURUSD Forex market trading strategies
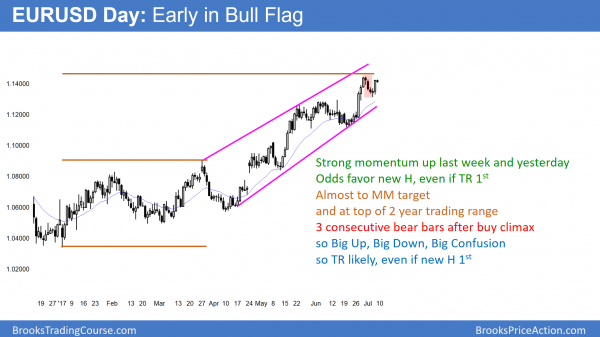
Yesterday rallied strongly above 4 day bear channel. However, the 3 consecutive bear bars makes a trading range more likely than a resumption of the bull trend
The EURUSD daily Forex chart yesterday broke strongly above a 4 day bull flag. Yet, that bull flag had 3 consecutive bear bars and one was strong. Therefore, yesterday’s bull breakout is more likely a bull leg in a developing trading range than a resumption of the bull trend. Furthermore, this is true even if today rallies to a new high. The odds are that there will be sellers above. In addition, the chart will probably be mostly sideways for a couple of weeks.
Since the momentum up in May and June was strong, the odds are that the EURUSD daily chart will break above last week’s high. It therefore should reach its measured move target. However, it is at the top of a 2 year trading range. Hence, the upside from here is probably 100 – 200 pips. That is because that is the top of the 2 year range, and most trading range breakout attempts fail.
Overnight EURUSD Forex trading
The EURUSD Forex market was in a 30 pip range since yesterday’s close. However, it sold off and rallied a few minutes ago on the U.S. Unemployment report. Nothing has changed from what I wrote above. The odds are that yesterday and today’s rally will fail around last week’s high and the chart will enter a trading range for a couple of weeks. Consequently, traders will look to sell rallies and buy pullbacks. In addition, they will be quick to take profits. This is because they believe the market will be in a 300 pip range for a couple of weeks.
Because the daily chart is in a bull trend and the top of the 2 year trading range is 200 pips higher, the odds favor a least slightly higher prices. Yet, since most trading range breakouts fail, this 6 month rally is probably just a bull leg in a 2 year range. It therefore will probably lead to a bear leg instead of a strong breakout above the range.
Summary of today’s S&P Emini futures price action and what to expect tomorrow
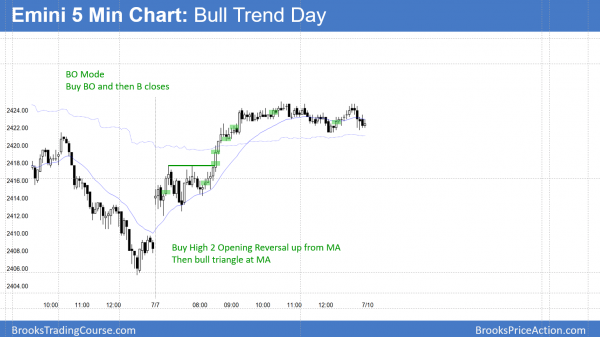
The Emini was in breakout mode for the 1st 2 hours. It then had a strong bull breakout. It had minor trend resumption up at the end of the day.
After 5 consecutive bear bars on the daily chart, the odds were that today would be have a bull. This is because the daily chart is still in a trading range, and 5 bars in one direction is unusual.
While the bulls reversed yesterday’s selloff, they only have 3 bull bars in 13 days. Furthermore, the weekly chart has 3 consecutive bear bars. The odds are that the Emini will go sideways to down for at least several weeks. The minimum target is the weekly moving average.
See the weekly update for a discussion of the price action on the weekly candlestick chart and for what to expect going into next week.
Traders can see the end of the day bar-by-bar price action report by signing up for free at BrooksPriceAction.com. I talk about the detailed S&P Emini futures price action real-time throughout the day in the BrooksPriceAction.com trading room. We offer a 2 day free trial.
When I mention time, it is USA Pacific Standard Time (the Emini day session opens at 6:30 am PST, and closes at 1:15 pm PST). You can read background information on the intraday market reports on the Intraday Market Update page.


