Dow 20,000 year end rally
Updated 6:55 a.m.
The Emini gapped up and rallied. The Dow is just below its 20,000 big round number. The Emini is at the top of the 10 day trading range, just below its all-time high. Because there has been a strong rally on the open, day traders will watch for evidence of a parabolic wedge top. There is none yet.
At the moment, the Emini Always In Long. The odds are that it will soon enter a trading range that will last 1 – 2 hours. The bulls will look for trend resumption later in the day and the bears will try to create a major trend reversal. Another common outcome of a strong initial rally is a Spike and Channel Bull Trend Day.
At the moment, the bulls are in control and the odds favor sideways to up for the next hour or two. So far, there is no evidence of a parabolic wedge top, but traders have to be ready for a reversal. Yet, the odds still favor the bulls.
Pre-Open Market Analysis
The Emini has been in a tight trading range for 9 bars on the daily chart. Because this is in a strong bull trend, it is a bull flag. The odds are that there a bull breakout and at least a minor new high.
The bears see this bull flag as a small double top after a buy climax. They also correctly believe that the Emini will test the August 2175 high. That is the breakout point. Since the July breakout pulled back below its breakout point, the odds are that this breakout will as well. Even if the Emini pulls back, the odds are that the pullback will become a big bull flag rather than a bear trend.
This is because the trend up on the daily, weekly, and monthly charts are strong. As a result, the bears will probably need a major trend reversal before they can create a bear trend. Hence, the 1st selloff will probably have to test the all-time high before bears will be willing to swing their shorts.
Overnight Emini Globex trading
The Emini has been in a tight bull flag for 9 days. This means that the odds favor a bull breakout. As a result, the Dow would finally break above the 20,000 big round number. Yet, there is no sign of a breakout. The overnight range has only been 3 points. Furthermore, Christmas week usually has the smallest ranges of the year. Because of the Breakout Mode setup, traders will be ready to trade the breakout if it begins this week. But, if the range on the 5 minute chart is only 2 – 3 points for an hour or more, most day traders should wait for a bigger range.
EURUSD Forex Market Trading Strategies
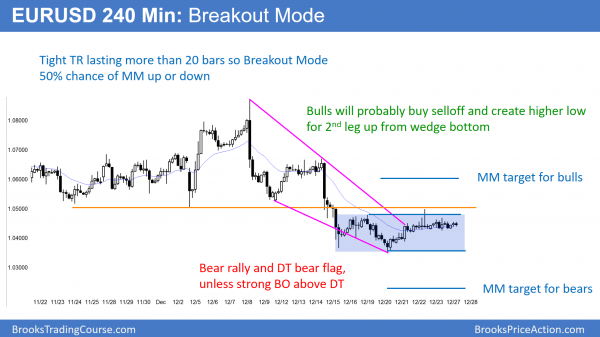
The tight trading range on the 240 minute EURUSD Forex chart is adding more bars. Now that it has lasted more than 20 bars, the probability of a bull breakout has become as high as for a bear breakout.
The EURUSD is at the bottom of its yearlong trading range.Hence, it is also at a 14 year year low. Yet it has been in a tight trading range for 8 bars. The 240 minute chart is therefore in breakout mode. Therefore the odds of a 100+ pip rally are now as high as for a 100 pip selloff.
Because of the holiday week, the odds are that the range will be small. The overnight range was only 20 pips, which is too small for most day traders. It is better to wait for the range to expand before even scalping. Swing traders should wait for the breakout.
Those trading the daily charts see that the bears have been in control for several weeks, but are concerned by the market stalling at the support of the yearlong trading range. They will be quick to exit their shorts if there is a strong reversal up because of a potential double bottom with last year’s low.
Traders are aware the currencies sometimes make major reversals at the 1st of the year. That is therefore part of the reasons for the bears hesitating to sell now. If there might be a reversal, they would rather wait to sell higher. Yet, if the bulls do not buy soon, the bears will sell and create a strong bear breakout and another leg down.
Summary of today’s S&P Emini futures price action and what to expect tomorrow
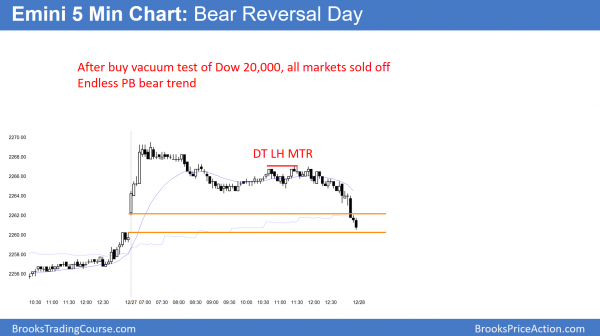
After a brief early rally, the Emini sold off in an endless pullback. It spent most of the day in a 10 tick range. The day ended as a bear reversal day.
The Dow got to within 20 points of 20,000, but then sold off. Yet, the selloff in the stock markets was weak. As a result, the 10 day trading range is still in effect. Since today was a reversal day at the top of the trading range, there probably will be some follow-through selling tomorrow.
Because the range is so tight, there are not many opportunities for day traders. This price action will probably continue for the rest of the week.
See the weekly update for a discussion of the price action on the weekly candlestick chart and for what to expect going into next week.
Traders can see the end of the day bar-by-bar price action report by signing up for free at BrooksPriceAction.com. I talk about the detailed S&P Emini futures price action real-time throughout the day in the BrooksPriceAction.com trading room. We offer a 2 day free trial.
When I mention time, it is USA Pacific Standard Time (the Emini day session opens at 6:30 am PST, and closes at 1:15 pm PST). You can read background information on the intraday market reports on the Intraday Market Update page.


