Double top, micro double top, and island top will create 5% March correction
I will update around 6:49 a.m.
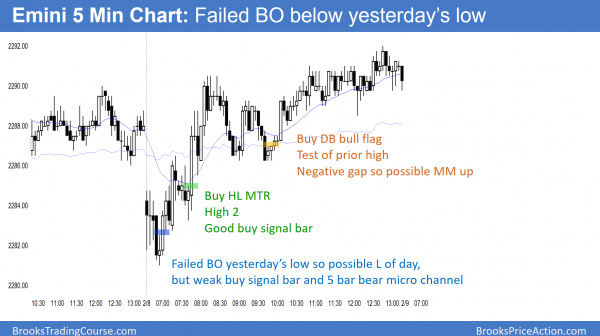
The Emini gapped down and did not have a bull body for the 1st 4 bars. It is therefore Always In Short.
While today gapped down, the gap was small. In addition the 1st 3 bars were dojis and formed an ii. This makes a big trend day up or down less likely. Furthermore, it increases the odds of a lot a trading range trading, like the Emini has had for several days.
There is still an increased chance of a trend day up or down because of the island top. Yet, this limit order market on the open increases the chances that the Emini will be sideways for an hour or two. Hence, unless the Emini creates strong trend bars up or down, trend traders will probably have to wait an hour or more.
Pre-Open Market Analysis
The Emini sold off yesterday, but bounced up from a wedge bottom. If it gaps down today, there would be a 2nd island top. Since a 2nd sell signal has a higher probability of success, traders will be ready to swing trade if there is selloff.
In addition, even if today does not gap down, yesterday formed a micro double top and a lower high. It is still a sell signal bar today. Hence, bears will sell if today trades below yesterday’s low. Yet, without a big bear day or a series of small bear days, the daily chart is still bullish. The odds still therefore favor higher prices.
Nothing has changed. The daily chart is still slightly more bullish than bearish, but the Emini never tested the August high. Because gaps late in trends usually close, the odds are that the Emini will test the August high before it reaches its measured move targets above. Therefore, there is a 60% chance of a 100 point selloff in the next 2 months.
Overnight Emini Globex Trading
The Emini has been in small trading ranges for 3 days. Hence, it is in breakout mode. This therefore increases the chances of a trend day up or down today or tomorrow.
The Emini is down 3 points in the Globex market. Hence, it is at yesterday’s day session low. If it gaps below yesterday’s low, it would create a 3 day island top. The bulls would buy the gap down because they would want the sell signal to fail. If today gaps down and the bulls close the gap, today could be a bull trend day.
Yet, if today gaps down, the bears would sell the open to keep the gap open. They hope that a 2nd island top would make traders believe that a 5% correction has begun. If they are correct, they might be able to keep a gap down open all day, and today could be a strong bear trend day.
EURUSD Forex Market Trading Strategies
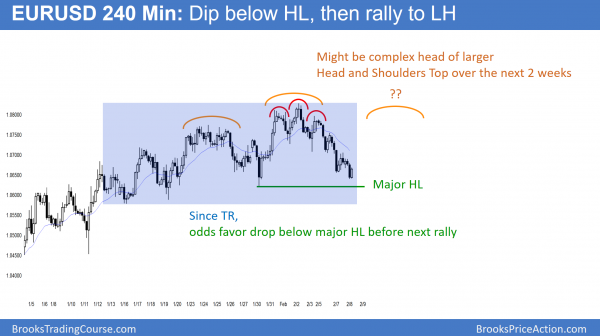
The EURUSD Forex market has been in a trading range for a month. Since a bear leg in trading range usually falls below support before the next bull leg begins, the current selloff will probably end below the January 30 low.
The EURUSD 240 minute Forex chart has sold off in a broad bear channel for 5 days. Since that is a weak bear trend, it is more likely a bear leg in the 4 week trading range. Because legs in trading ranges usually go past support or resistance before reversing, the minimum goal for the bears over the next few days is a drop below the 1.0620 January 30 major high low.
Daily EURUSD Forex chart
While it is possible that this bear leg is the early stage of a resumption of the bear trend on the daily chart, the selloff lacks consecutive big bear trend bars. Furthermore, the 2017 rally lacked consecutive big bull trend bars. It therefore looked like a bull leg in a trading range. Since trading ranges resist breaking out into trends and the current selloff is not a breakout, the odds are that the current trading range will continue.
Because the rally on the daily chart broke above its bear channel, bulls will watch any selloff over the next month to see if it forms a higher low. If so, traders will begin to buy, hoping for a head and shoulders bottom (higher low major trend reversal).
Overnight EURUSD Forex trading
The EURUSD 60 minute Forex chart as been rallying for 4 hours after a new low in its broad bear channel. Yet, it failed to fall below the January 30 low. The 240 minute chart is therefore still forming higher lows. Hence, it is still in a broad bull channel (bull trend).
Because it is also in a month-long trading range, the odds are that it has to fall below support before a bull swing begins. Hence, as strong as the overnight rally has been, the odds are that the EURUSD will fall below 1.0620 before it can have a rally lasting more than a couple of days.
Yet, even if this is the start of a rally, it will probably fail to get above last week’s high. Instead, it will probably form a lower high and have a 2nd leg down from last week’s high. That lower high would be a right shoulder of a head and shoulders top on the 240 minute chart.
If the pattern triggers, the next target would be the January 11 1.0453 higher low. If the EURUSD finds support there, traders would be ready to buy a head and shoulders bottom on the daily chart.
Summary of today’s S&P Emini futures price action and what to expect tomorrow
Today gapped below yesterday’s low and therefore created another island top. Yet, the bulls quickly closed the gap. After a series of consecutive buy climaxes, the Emini went sideways for 2 hours. The bulls got some trend resumption up at the end of the day.
Today reversed up from below yesterday’s low and then entered a trading range. this is the 4th consecutive day where the 2nd half was in a tight range. The pattern will probably change soon. The bulls want a breakout above 2300 and the old high, but the bears want a double top with that high. The odds favor the bulls. Yet, any new high will probably not last long before reversing.
See the weekly update for a discussion of the price action on the weekly candlestick chart and for what to expect going into next week.
Traders can see the end of the day bar-by-bar price action report by signing up for free at BrooksPriceAction.com. I talk about the detailed S&P Emini futures price action real-time throughout the day in the BrooksPriceAction.com trading room. We offer a 2 day free trial.
When I mention time, it is USA Pacific Standard Time (the Emini day session opens at 6:30 am PST, and closes at 1:15 pm PST). You can read background information on the intraday market reports on the Intraday Market Update page.


