Video duration 7min 33sec. Market outlook video reports for 2021: Market outlook for BitcoinMarket outlook for Bond futuresMarket outlook for Crude oilMarket outlook for S&P500 EminiMarket outlook for EURUSD ForexMarket outlook for Gold futures Video transcript Introduction: Market outlook 2021 gold futures Hi, everyone. I’m Al Brooks. Thank you so much for your attention. At […]
Market outlook for 2021: Bond futures
Video duration 9min 37sec. Market outlook video reports for 2021: Market outlook for BitcoinMarket outlook for Bond futuresMarket outlook for Crude oilMarket outlook for S&P500 EminiMarket outlook for EURUSD ForexMarket outlook for Gold futures Video transcript Introduction Hi, everyone. I’m Al Brooks. Thank you so much for your attention. At the end of every day, […]
Market outlook for 2021: S&P500 Emini
Video duration 28min 09sec. Market outlook video reports for 2021: Market outlook for BitcoinMarket outlook for Bond futuresMarket outlook for Crude oilMarket outlook for S&P500 EminiMarket outlook for EURUSD ForexMarket outlook for Gold futures Video transcript Introduction Hi, everyone. I’m Al Brooks. Thank you so much for your attention. At the end of every day, […]
Day trading the 5 minute emini chart
Trading does not have to be complicated. For most traders, if they take time to look carefully at candle or bar charts, they will quickly discover that price action alone is all you need to observe to be successful. As a bar develops, consider the tone of the market, whether the bulls or bears are […]
Learn how to trade trend channels
Markets are either in trends or trading ranges, and trends can be strong or weak. When they are strong, the market is moving clearly and quickly to a new price. There are several large trend bars or a series of ordinary trend bars, and there is little overlap between adjacent bars. This is the spike […]
Trading price action in treasury bond futures
Once you achieve an understanding of price action dynamics, all you need to trade successfully is a five-minute chart and a 20-bar exponential moving average (EMA). This works for scalping trades in the E-mini S&P 500, but also stocks and options for intraday and daily swings. It’s also quite effective in 10-year Treasury notes (TY). […]
Trade the S&P with price action fundamentals
Price action fundamentals in the S&P The term price action is vague and means different things to different people. The broadest definition refers to any representation on a chart of any aspect of price movement during the course of trading. This includes any financial instrument, on any type of chart, in any time frame. Most […]
Learn to trade final flags for Emini success
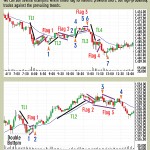
A five-minute E-mini S&P 500 chart provides an incredible amount of information. But despite this massive flow of information, simple analysis of its price action is all that is needed to trade successfully. One such strategy is based on flag formations, and a final flag usually presents several profitable entries every day. A flag formation […]
Learn how to trade: predicting trend reversals
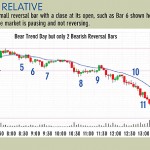
Learning how to trade Emini S&P trend reversals is time well spent. A reversal bar on a candlestick chart is any bar with a tail on one end and its close near the other end. A bullish reversal bar has a close near its high, and a bearish reversal bar has a close near its […]
Learn how to trade Emini wedges
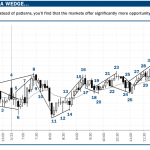
You can learn to trade more subtle wedges in the S&P Emini giving you more setups to look for. A wedge reversal pattern occurs when the market makes three pushes in either a rising or falling convergent triangular pattern. However, if you are a little flexible with how you define a wedge, you will discover […]


