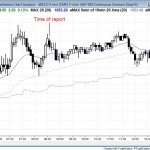
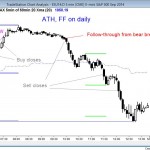
This chart was posted after the close. It shows that the day continued as a trading range day, as was likely to be the case. This report was posted at 8:35 am PST. The key feature in today’s intraday update is the trading range price action. Today is the last day of the month so […]
Intraday market update, June 27, 2014: trading range day
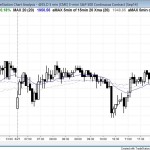
This chart was posted after the close. Today was a trading range day that had a failed breakout to a new low of the day and then a trend reversal up to a new high of the day. It tested the open of the week and created a doji candle on the weekly chart. Posted […]
Intraday market update, June 26, 2014: sell vacuum test of yesterday’s low
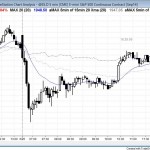
Posted 7:34 am PST. I posted the chart below after the close. Yesterday ended always in short with the reversal down from the wedge top and the 3 consecutive bear bars. A trading range was likely after yesterday’s major trend reversal, but instead there was a strong bear breakout on the open that reversed up […]
Intraday market update, June 25, 2014: major trend reversal
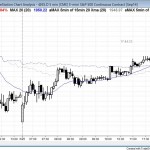
Posted 7:45 am PST. Yesterday ended with consecutive sell climaxes in a tight channel, so 2/3 chance of a major trend reversal today with at least 20 bars and 2 legs up. The market had a lower low major trend reversal on the first bar and became always in long. After a reasonably strong 5 […]
Intraday market update, June 24, 2014: wedge top and trend reversal day
Posted after the close, but this is from the discussion in the chat room today. Today had a parabolic wedge top and trend reversal after an early rally off the 60 min 20 bar exponential moving average. The Emini became always in long on the second bar and then rallied strongly up to a parabolic […]
Intraday market update, June 23, 2014: Trading range day
Posted 9:23 am PST. Yesterday had a 3.5 point range, making it one of the smallest days of the past few years. It formed a sell signal on the daily chart for a final flag trend reversal. Like most trend reversals, the risk is small, but this means that the probability is small as well. […]
Intraday market update, June 20, 2014: opening reversal
Posted 9:06 am PST. The SPY paid dividends today, causing it to gap down, unlike the Emini, which gapped up to within a tick or so of the top of the channel on the weekly chart. Since today is a Friday, the market will look at magnets on the weekly chart at the end of […]
Intraday market update, June 19, 2014: Trading range day
I am still experimenting with how best to create an intraday update that is helpful to traders, but I need to do it in a way that will not interfere with my trading. Please be patient. 8:30 am, PST. Yesterday was a strong bull breakout so the odds favor some follow-through today. So far, it […]
Day trading the 5 minute emini chart
Trading does not have to be complicated. For most traders, if they take time to look carefully at candle or bar charts, they will quickly discover that price action alone is all you need to observe to be successful. As a bar develops, consider the tone of the market, whether the bulls or bears are […]
Learn how to trade trend channels
Markets are either in trends or trading ranges, and trends can be strong or weak. When they are strong, the market is moving clearly and quickly to a new price. There are several large trend bars or a series of ordinary trend bars, and there is little overlap between adjacent bars. This is the spike […]
