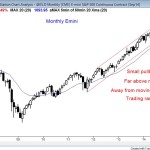
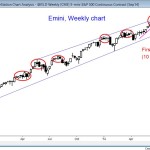
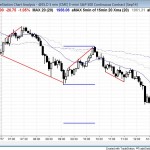
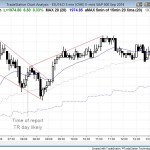
The Emini weekly chart is at the top of the channel and it is forming a possible buy climax in an overbought bull trend. Three weeks ago, the weekly Emini had a small breakout above the top of the channel, and this week, it briefly broke above a measured move target (for the projection, I […]
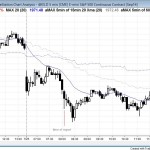
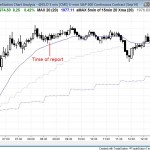
Intraday market update, Friday, July 25, 2014: island top in the stock market
The Emini had a wedge bear flag below the moving average on the open, and the opening range was about half of an average day’s range. This is a setup for a measured move up or down and a trending trading range day. The bear breakout below the bottom of the wedge was the entry […]
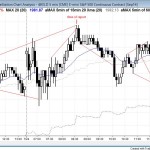
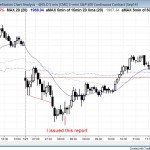
Intraday market update, Thursday, July 24, 2014: bull trend opening reversal
I posted this chart after the close. After a bull trend opening reversal at 7:05 am PST, the Emini made a new high, but it formed a parabolic wedge and an expanding triangle top. This resulted in a deep pullback that ended with a parabolic wedge bottom at 10:10 am. It sold off from a […]
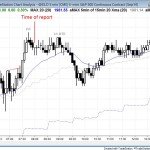
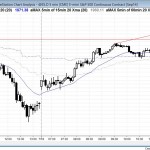
Intraday market update, Wednesday, July 23, 2014: bull trend opening reversal
I posted this chart after the close. The bulls had a bull trend opening reversal at the moving average, but the market then had a parabolic wedge top at 7:45 am. This was followed by a small lower high major trend reversal. It formed as a small double top in a tight trading range, as […]
Intraday market update, Tuesday, July 22, 2014: breakout to an all time high
I posted this chart after the close. The Emini and stock market broke to a new all time high, but the breakout and follow-through were weak. The market entered a tight trading range. The bears were able to test the open of the day in the final hour, but the Emini worked back up into […]
Intraday market update, Monday, July 21, 2014: bear trend reversal
I posted this chart after the close. Today sold off to a parabolic wedge bottom just above yesterday’s low, but the selling lacked consecutive big bear trend bars. This made the selloff more likely a bear leg in a trading range rather than in a bear trend. Also, since yesterday (Friday) was such a strong […]
Weekly market update, Saturday, July 20, 2014: breakout of the trend channel
The weekly Emini candle chart shows the market testing the top of the bull channel, setting up either a bull breakout or, more likely, a failed bull breakout of the trend channel. The most important price action in the weekly market update is the attempt to breakout of the trend channel. Most attempts to break […]
Intraday market update, July 18, 2014: bull trend reversal
I posted this chart after the close. Yesterday had a sell climax in a tight bear channel so the odds favored a rally today that would last at least a couple of hours. The Emini candle chart had a small pullback bull trend day, and it closed near the open of the week, creating a […]
Intraday market update, July 17, 2014: parabolic wedge top
I posted this chart after the close. The market again rallied above last week’s high, but reversed down from a parabolic wedge top. It formed a wedge bottom at the low of the day and held above the most recent 60 minute higher low. After testing the open, it began a small pullback bear channel […]
Intraday market update, July 16, 2014: second failed breakout
I posted this chart after the close. The Emini sold off again from above last week’s high. However, the bear trend on the open looked more like a bear leg in what would probably become a trading range, which was the case. The bulls bought the wedge bull flag for the low of the day, […]
