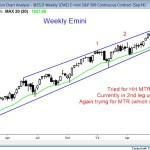
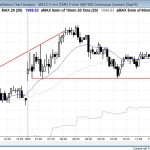
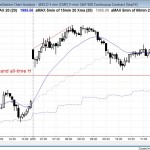
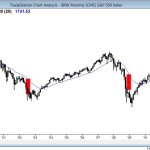
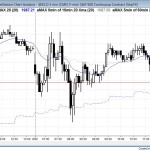
The monthly S&P500 Emini candle chart is in a strong bull trend The S&P500 Emini monthly chart is in a strong bull trend, although it is overbought. Although the monthly S&P500 Emini chart is in a buy climax at the top of the bull channel, it is still strong bull trend and there is no […]
Intraday market update, August 29, 2014: trading range price action
The S&P500 Emini had a strong bull trend reversal. After a long bear channel, the Emini retested its high going into the close. End of day comments about today’s Emini price action and day trading The S&P500 Emini reversed up in a parabolic wedge from last week’s high. It then formed a parabolic wedge top […]
Intraday market update, August 28, 2014: bull trend reversal
The S&P500 Emini gapped down on the daily chart, forming a 3 day island top. It then had a bull trend reversal up, turning the island top into a failed top. Day traders saw the price action as that of a broad bull channel. End of day comments about today’s Emini price action and day […]
Intraday market update, August 27, 2014: trading range price action for day traders
The S&P500 Emini was in a trading range today for online day traders, and it might get drawn down to test the July high by Friday’s close. End of day comments about today’s Emini price action and day trading The Emini today did what it has been doing for weeks, and spent most of the […]
Intraday market update, August 26, 2014: bull breakout above resistance
Like most days for the past several weeks, the S&P500 Emini’s price action today was that of a quiet trading range day. However, it broke above 2,000, which became a magnet for the rest of the day. There were few opportunities for online day trading, and beginner day traders had to be careful. Experienced traders […]
Intraday market update, August 25, 2014: gap up on the weekly chart
The S&P500 Emini’s price action today was that of a quiet trading range day. The Emini gapped above last week’s high and then tested into the gap in the middle of the day. The stock market then closed around the open, and created a doji candle on the daily Emini chart. End of day comments […]
Emini weekend update: Sunday, August 24, 2014: exhaustion gap
The monthly chart of the S&P500 cash index has only been this far above the moving average 3 other times in the past 20 years. Even though it might get further from the moving average, it will probably do what it did after those prior times and reverse back to the moving average. The 3 […]
Intraday market update, Friday, August 22, 2014: trading range price action
I posted this chart after the close. The S&P500 Emini had trading range price action from the open. There were two legged moves up and down all day. End of day comments about today’s Emini price action and day trading The S&P500 Emini sold off to the 60 minute moving average, which it has not […]
Intraday market update, Thursday, August 21, 2014: broad bull trend channel
I posted this chart after the close.The S&P500 Emini’s dominant price action feature of the today for day traders was the opening reversal up from the double bottom at the July high. End of day comments about today’s Emini day trading The S&P500 Emini reversed down sharply at the open, but it turned out to […]
Intraday market update, Wednesday, August 20, 2014:
I posted this chart after the close. The S&P500 Emini sold off at 11 a.m. PST on the report, but then reversed up strongly to a new all-time high. There was a pullback into the close. End of day comments The Emini rallied until just before the 11 a.m. report. The stock market reversed down […]
