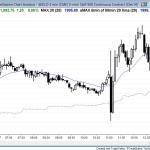
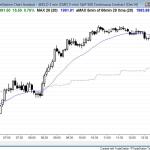
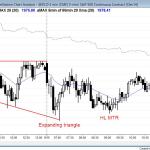
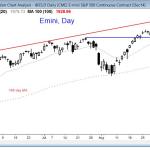
The Emini opened with a final flag bull trend reversal, but it then entered a bear channel and became a trading range day. It collapsed in a strong bear breakout in the final bars. End of day comments about today’s Emini price action and day trading The Emini reversed up sharply from the breakout below […]
Intraday market update, September 22, 2014: bear trend on the open
The Emini broke below yesterday’s low and the 60 minute moving average, and then had a trend from the open bear trend. It had trend resumption down after a 10:35 moving average gap bar. This led to a lower low major trend reversal, and more trading range price action.
Emini weekend update: September 21, 2014: breakout on the weekly candle chart
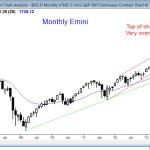
The monthly S&P500 Emini candle chart is in a strong bull trend, but overbought The S&P500 Emini monthly chart is in a strong bull trend, but it is overbought. Although there is a bull breakout on the weekly candle chart, the monthly chart is very overbought. It can continue to be overbought for a long […]
Intraday market update, September 19, 2014: failed breakout above the bull channel
Time of update 7:26 a.m. PST. S&P500 Emini intraday market update for price action day traders The Emini gapped up and broke above the top of the 60 minute channel, but reversed down slightly. This is a failed breakout above the bull channel. There was only one bull candle in the first 11 bars. Although […]
Intraday market update, September 18, 2014: trading range price action
The Emini had a failed bear breakout early. This bull reversal controlled the price action for the rest of the day, resulting in a late bull trend resumption. End of day comments about today’s Emini price action and day trading The S&P500 Emini had a strong reversal up from a bear breakout attempt at 7:35 […]
Intraday market update, September 17, 2014: Trading range open
This chart is from just before the close. The FOMC report at 11 a.m. created the dominant price action feature of the day. It led to big reversals up and down, but it again failed to hold above 2,000. End of day comments about today’s Emini price action and day trading The dominant feature today […]
Intraday market update, September 16, 2014: bull trend
The Emini had a trend from the open bull trend. End of day comments about today’s Emini price action and day trading The Emini reversed up from a higher low major trend reversal that formed over two days. Today’s low was a double bottom with the first entry, which formed at 9:05 a.m. yesterday. At […]
Visual Learning as Tool to Structure Profitable Trading Behavior
We always bank on our past experiences, especially if they have been successful ones, when confronted with a new task. In 2006, when I started teaching myself how to trade I fell back to my most recent learning experience that started in year 2000 – using visual learning as a tool to help control my […]
Intraday market update, September 15, 2014: bull trend reversal
I had to leave a few minutes early, so this chart does not include the final few bars. The S&P500 Emini reversed up from below yesterday’s low with an expanding triangle bottom. It then had a higher low major trend reversal and wedge bull flag at 9:05 a.m. PST. End of day comments about today’s […]
Emini weekend update: September 14, 2014: trading range
The monthly S&P500 Emini candle chart is in a strong bull trend but overbought The S&P500 Emini monthly chart is in a strong bull trend. It is too early to comment on this month’s candle other than to say the price action is overbought and the stock market will probably pull back soon. I have […]
