Market Overview: Nifty 50 Futures
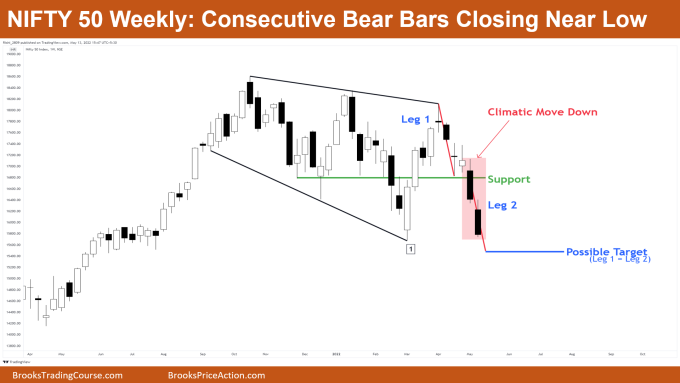
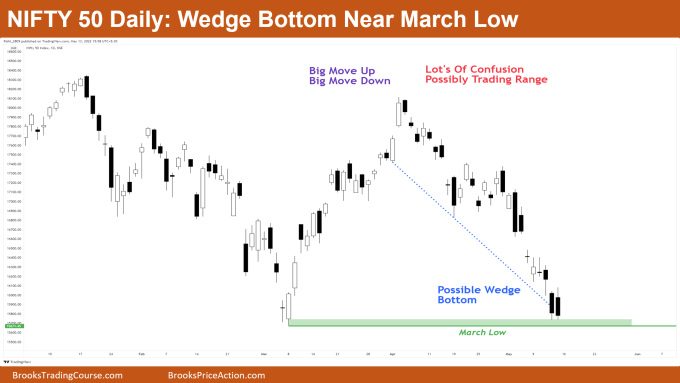
Nifty 50 futures consecutive bear bars formed on weekly chart closing near their lows, and also near measured move target shown in the weekly chart below. Nifty 50 on the daily chart forming micro double bottom just above March month low and also making a wedge bottom so possible reversal expected.
Nifty 50 futures
The Weekly Nifty 50 chart

- General Discussion
- After breaking below the inside bar earlier, the Nifty market formed consecutive bear bars closing near their lows.
- This is not very bearish because the move down is potentially very climatic.
- Whenever you see a climatic move down like this, at a trading range bottom, then higher chances that market will at least bounce with 2 legs sideways to up.
- But you have to be cautious with these types of trades. Only buy after you see at least a couple of bull bars closing near their highs.
- That would signal that bulls are interested in buying the market and bears are taking their profit.
- Deeper into the price action
- Looking at the prior swing lows on weekly chart, you may observe that bulls were buying every swing low.
- Bears who shorted near the top were taking profits at the swing low.
- With this kind of price action, this generally means the market may be in a broad channel or trading range.
- Pay attention to what the market doing at the low of Bar 1. Are bulls going to buy again or not?
- Patterns
- If market has another bear bar closing near its low next week, then chances are we will get a measured move down.
- Overall price action for current market is trading range price action as lows are continuously bought.
- Market near Leg 1 = Leg 2 measured move target, which may cause some upside moves on the lower time frame charts.
- Pro Tip
- Whenever market is in a trading range and has a climatic move down to the bottom of the range, with bear close below the trading range low, then chances are low for a successful breakout of the range.
- Climatic moves are not sustainable thus instead of selling the close you should look to buy on a successful reversal.
The Daily Nifty 50 chart

- General Discussion
- Market has had a big move up and big move down.
- When you come across this kind of market move then high chance that it’s in a trading range.
- Market near important support area, the March month low.
- Deeper into price action
- In general, whenever you see climatic moves up near trading range top, and climatic moves down near trading range bottom, these are generally traps (frequently as 2nd leg traps).
- Overshoot of wedge can be seen near bottom of the trading range. If market goes lower there is a 75% chance of reversal to the upside within 10 bars or two legs (whichever occurs first).
- Patterns
- Market forming micro double bottom near important support. Wait for a failed breakout below that and look for a High 1 bull bar closing near its high.
- Market near broad trading range so best to wait for buy. Do not sell near trading range bottom.
- Also have wedge bottom near bottom of trading range, thus expect at least two legs sideways to up likely.
Market analysis reports archive
You can access all weekend reports on the Market Analysis page.

