Market Overview: Nifty 50 Futures
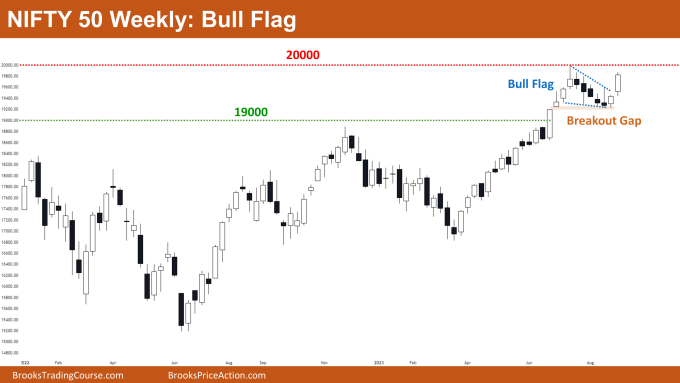
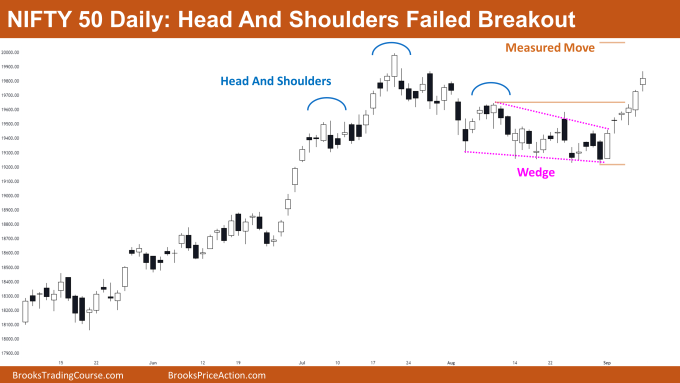
Nifty 50 Bull Flag on the weekly chart. On the weekly chart, the market formed a strong bull bar following an unsuccessful attempt at a reversal. Bulls gave a bull breakout of the bull flag, and based on the height of the bull flag, this could cause a measured move up. Because the market is still trading below the big round number 20000, some traders might decide to postpone buying. The market also demonstrated a breakout gap that could result in a measured move up based on the measuring gap. On the daily chart, the Nifty 50 has formed a series of bull bars this week. Immediately following the head and shoulders breakout, bears were unable to provide strong follow-through bars. The best bears can get now is a trading range.
Nifty 50 futures
The Weekly Nifty 50 chart

- General Discussion
- Until bears are able to give strong consecutive bear closes below the 19000 level, traders shouldn’t have any plans to sell in this strong trend.
- Traders can buy at the high of the current bar and aim for measuring gap measured move target. Plan for at least 1:2 (risk to reward).
- Conservative traders may choose to hold off until the market closes with a solid strong candle above the 20000 level. However, this results in a large stop loss and, as a result, a bad risk reward ratio.
- Deeper into the price action
- Bears made a very feeble and likely unsuccessful attempt to reverse the strong bull trend.
- The bear bars formed to reverse the market are weak compared to the bull bars formed in order to resume the bull trend.
- The breakout gap could not be filled by bears; this is a bullish sign that will encourage more traders to buy the market.
- Patterns
- The market is currently trading very near the 20000 level; if bulls are able to successfully break through this level, there is a good chance that a measuring gap measured move will occur.
- Bears will only be able to get a trading range if bulls are unable to provide a bull breakout of the 20000 level. And in this situation, traders should employ the buy low, sell high strategy.
The Daily Nifty 50 chart

- General Discussion
- Bears shouldn’t sell because the market is likely to reach the measured move because the bulls gave a strong breakout of the wedge.
- Bulls can enter on a high-1 to anticipate the wedge breakout’s measured move target.
- Deeper into price action
- In the above chart, if you look at the bars on the left, you’ll see that the market has formed an excessive number of overlapping bars, bars with tails, and poor follow-through bars after a strong bar.
- These indicate a trading range. Bulls have a very high chance of creating a trading range if they are unable to successfully break out above the 20000 level.
- The best that bears can hope for is a trading range because they were unable to form strong consecutive bear bars.
- Patterns
- This week market gave a strong breakout of the wedge which can lead to a measured move up.
- Bears failed to provide strong follow-through bars after the breakout, increasing the likelihood that the head and shoulders pattern will develop into a big trading range.
Market analysis reports archive
You can access all weekend reports on the Market Analysis page.

