Market Overview: NASDAQ 100 Emini Futures
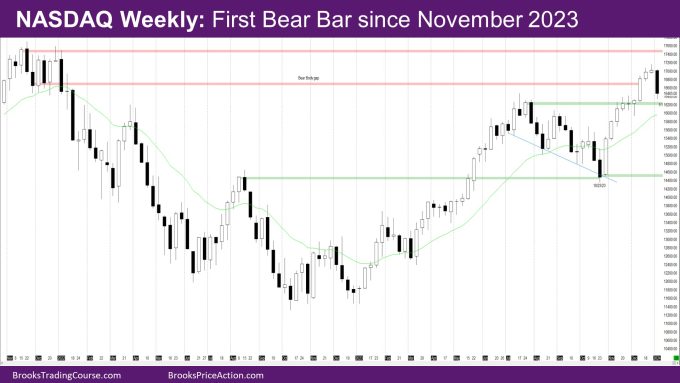
The NASDAQ Emini futures week is a big bear trend bar with a small tail below. It is the first bear bar since November 2023. It also closed the breakout gap with July high.
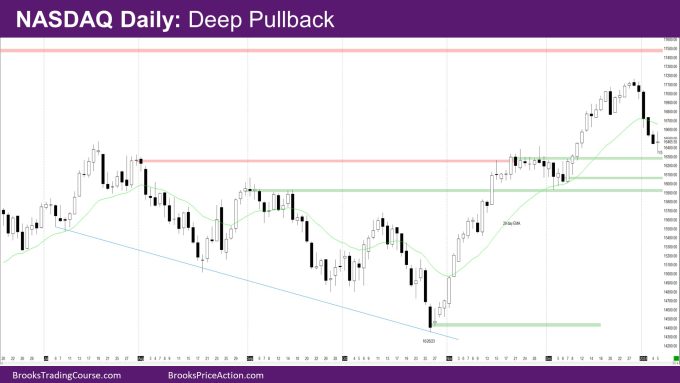
On the daily chart, the market had three consecutive trend bear bars and then closed with a doji on Friday.
NASDAQ 100 Emini futures
The Weekly NASDAQ chart

- The week is a bear trend bar with a small tail below.
- This week reversed most of the bull bars of the past 3 weeks.
- It has also closed the breakout gap with the July high. The body gap with the July high close is still open.
- Next couple of weeks is important – Can bears create a follow-through bear bar next week closing below this week’s low?
- Can bears create two bear closes far below the July body gap?
- Bulls want the opposite – They want next week to be a bull bar or a doji bar and keep the body gap open.
- The last monthly report had mentioned that it is unlikely for January to be a bull bar with a low above last month’s low – creating a bull micro-channel.
- So, its likely that January is a bear bar, or an inside bull bar or a bar with the low lower than the December low.
The Daily NASDAQ chart

- Friday is a doji bar closing around the mid-point of the bar.
- Monday was a trading holiday for New Year’s Day.
- Tuesday, Wednesday, and Thursday were good trend bear bars closing below the prior bar’s low.
- The market is back below the daily exponential moving average (EMA) with two closes below it.
- It is a deep pullback to the move up in December.
- It is back at the top of the trading range from July and November.
- Given the strong leg down this week, there will likely be another leg down.
- Bulls would like to keep open the bull body gap with November high close.
- There is a cluster of support below the current price shown by the green lines on the chart.
Market analysis reports archive
You can access all weekend reports on the Market Analysis page.

