Market Overview: NASDAQ 100 Emini Futures
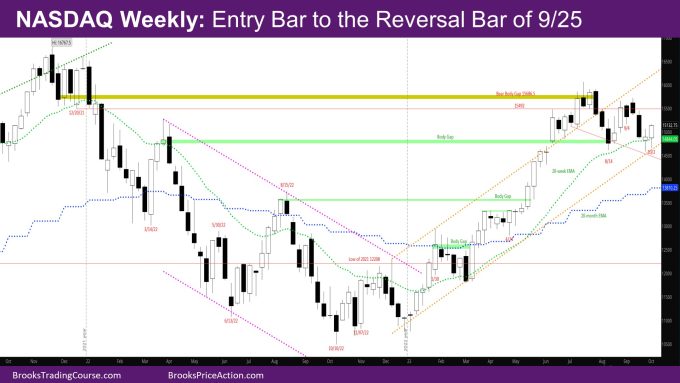
The NASDAQ Emini futures week is a bull trend bar with a tail below at the weekly exponential moving average (EMA). It is an entry bar to the reversal bar of 9/25, closing above the high of last week.
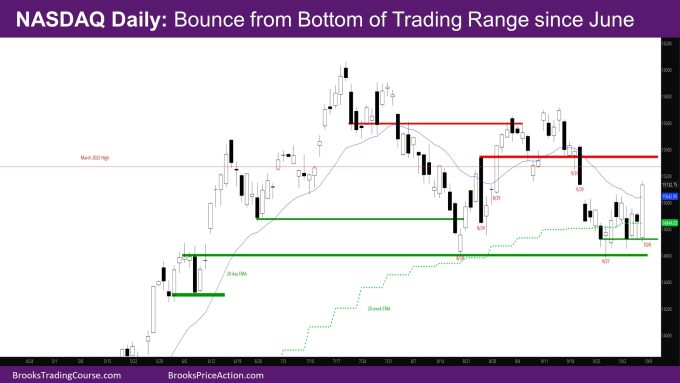
On the daily chart, this week looks like a trading range and an attempted breakout of the trading range on Friday.
NASDAQ 100 Emini futures
The Weekly NASDAQ chart

- The week is bull bar with a good body and a tail below.
- It is a good entry bar, barring the tail below, to a not so good doji bull reversal bar last week.
- Last week was like a trading range bar.
- This week went near the bottom half of last week, then reversed and closed above the high of last week.
- Next bulls need a good follow-through bar to confirm it is breaking out of the trading range of last week.
- As mentioned in prior reports, there will likely be another leg down even if it is a higher low.
- There are likely sellers higher – close of the inside bear bar 9/4, that were expecting a stronger second leg up based on the bar of 8/28.
- At the same time, bulls have been strong enough so far to prevent a close below the close of 8/14 – the low close of the 1st strong leg down.
- They have also prevented multiple bear closes below the bull body gap from March 2022.
- To call the bull gap effectively closed, bears need a couple of bear closes below that gap.
- If bulls can go up from here, the body gap close would be a considered a negative gap – a small overlap, but trend resumption up.
The Daily NASDAQ chart

- Friday is a strong bull trend outside up (OU) bar with a close above the daily EMA.
- This is the first time the market has closed above the EMA since September 18.
- While this is a show of strength on part of the bulls, it is more likely to attract sellers since most of the body of this week is below the EMA, and the market is at the 9/20 low, where the market gapped down from a possible double-bottom.
- There are likely sellers near the high of 9/20 or the buy signal bar of 9/19 that triggered and then failed.
- Bulls need a strong follow-through bar on Monday to negate the above.
- Prior reports had mentioned that there would likely be sellers below the strong bull bar of 8/28.
- This happened at the end of last week when the market almost reached the low of 8/28 and then sold off.
- That selloff continued earlier this week, when the market sold off towards the low of last week.
- It then had a pullback on Wednesday, and another leg down Thursday that reversed.
- Friday went below the low of Thursday and reversed up as a big OU bull bar.
- Bulls see the market reversing from a Wedge bull flag down to 9/27 and a double-bottom with 8/18, at the bottom of what looks like a trading range since June.
- Bears see the last 2 weeks as a 2 legged-pullback to the EMA from the right shoulder of a head-and-shoulders since June, and want a break below the neckline.
- The market likely will have another push down due to the reasons mentioned above.
- At the same time, given the strength of Friday, it is likely that there will be three pushes up to the close of 9/19 or the high of 9/20 before another leg down.
Market analysis reports archive
You can access all weekend reports on the Market Analysis page.

