Market Overview: NASDAQ 100 Emini Futures
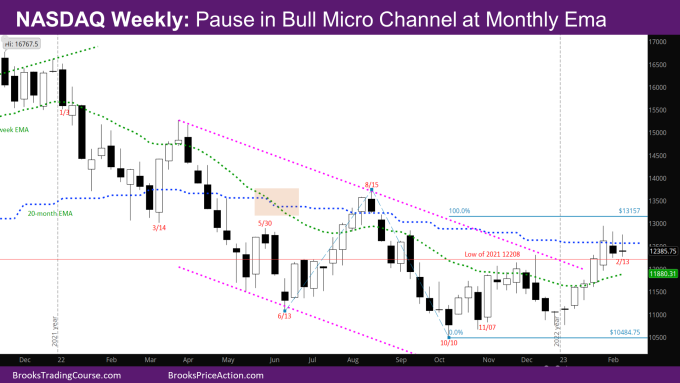
The NASDAQ Emini futures continued pause with another doji week sideways at the monthly exponential moving average (EMA).
The month so far is a bull bar with a big tail above. As expected, the upside was limited given big sideways bars in the previous few months. It is likely February will disappoint bulls with a tail above.
NASDAQ 100 Emini futures
The Weekly NASDAQ chart

- This week’s candlestick is a doji reversal bar inside last week’s bar.
- Last week was an inside week to the prior week. This is a breakout mode situation – i.e. it is better to wait for a strong breakout to determine whether the market breaks up or has a pullback first.
- The leg up in January is strong enough that there should be another leg up after a pullback.
- If bears produce weak bear bars in the pullback, bulls will buy for another leg up.
- If bears can produce a pair of strong bear bars closing on their lows, bears will sell assuming the monthly EMA is working as resistance.
- Given the bull micro channel going on since January (low of bar higher than prior bar low), there were expected to be buyers below last week.
- This week did not go below last week, instead going up from above last week’s close and then selling off from upper third of last week’s bar.
- The bull targets mentioned last week are still valid – one possible bull target is the Leg1/Leg2 target at 13157 where Leg 1 is the move up from June to August and Leg 2 is the move up from October.
- Another target is the close of Week of 8/8 at 13569.75 – the last bull bar of the micro channel up in August. That was a reasonable buy the close bar, and there are trapped bulls up there.
- If there is a pullback, it should go to the high of the week of January 9 around 11600. It was a reasonable sell at the weekly EMA for a possible 2nd leg down back, so a test target.
- Since bulls did not have a good signal bar, this is still likely a minor reversal, and bulls will need a good signal bar around the bar from the week of January 2.
The Daily NASDAQ chart

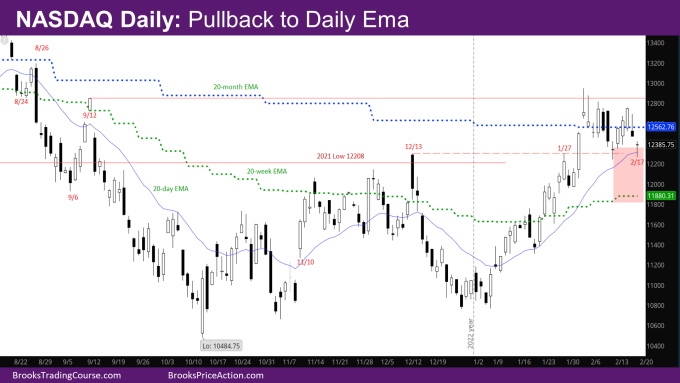
- Friday’s NQ candlestick is a doji bar at the bottom of the 2-week trading range just below the monthly EMA, and at the daily EMA.
- This week started with three good bull days Monday-Wednesday to the top of the trading range. Thursday was a bear day, and Friday a doji.
- The market is back at the breakout point of January 27.
- In the trading range of the last two weeks, there are stronger bull bars than bear bars. This week had three consecutive bull bars closing on their highs.
- At the same time, the signal bars at the bottom of the trading range are doji bars and any breakout of doji bars is not likely to result in a bull trend.
- Given the monthly EMA is still far away from the weekly EMA, the market will have to go sideways between the monthly and weekly EMA till the monthly EMA comes close enough to the weekly EMA (like back in mid-August) for the market to go above all of them.
Market analysis reports archive
You can access all weekend reports on the Market Analysis page.

