Market Overview: NASDAQ 100 Emini Futures
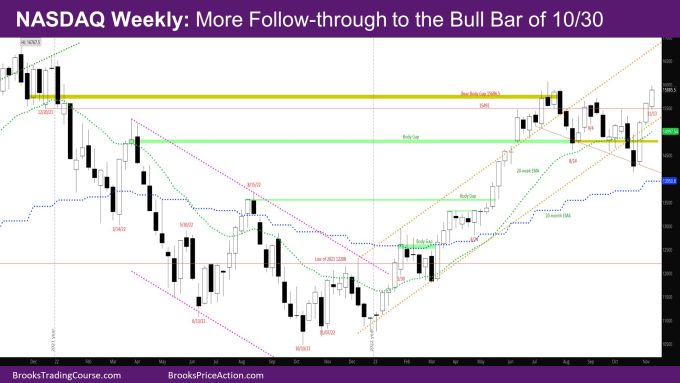
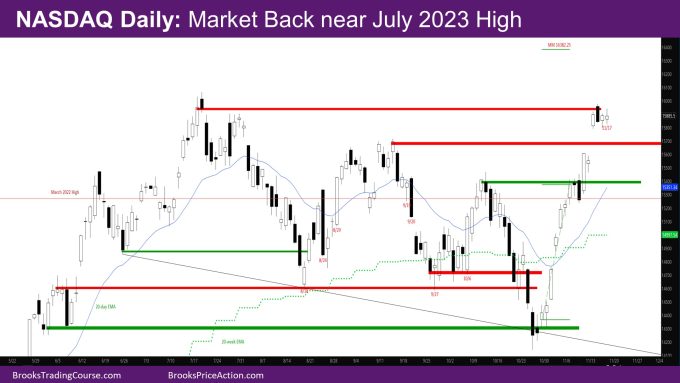
The NASDAQ Emini futures week is more follow-through to the bull bar of 10/30. The market is back near July 2023 high. On the daily chart, this week gapped up above the lower high of 9/14.
The monthly bar is a strong bull trend bar with a close above the July close. As mentioned last week, the problem for the bulls is that the bar is already bigger than an average monthly bar from the past few months, and there are still two weeks left in the month.
NASDAQ 100 Emini futures
The Weekly NASDAQ chart

- The week is bull trend bull bar with small tails.
- It is a good follow-through bar to the bull bar of last week.
- Last week’s report had questioned whether the market would be a trading range and have a bad follow-through this week or try to breakout above the July highs.
- Bears needed to prevent another good bull bar, which they could not.
- This week closed above the July high close. So, this week is the highest close of the year so far.
- Based on the good bull bars of the past 3 weeks, the market should go above the July high.
- The next target for the bulls is the high close of 2021.
- As mentioned above, the monthly bar is already too big and since there are two more weeks in the months, it’s likely that the next two weeks are sideways to down to result in a pullback, and then the buyers come in again in December.
- This would be similar to what happened at the end of March – mid April 2023
The Daily NASDAQ chart

- The most notable price action of this week was when Tuesday gapped up far above Monday, and far above the next resistance shown on the chart – the lower high of September.
- The market went sideways the rest of the week near the July high close.
- Next week, the market will decide how to deal with the July high. At this point, it is very likely the market will at least go above the July high in the next two weeks.
- The question is will it continue going higher or then reverse and go sideways to down for the next two weeks.
- The Measured Move (MM) target of the bull bodies of the spike from the week of 11/6 at 16382.25 is in play for the rest of the year.
- The market might make a right shoulder of the inverted head and shoulder (INVH) for the next couple of weeks and then try to go higher in December.
Market analysis reports archive
You can access all weekend reports on the Market Analysis page.

