Monthly S&P500 Emini candle chart: Sell signal bar in overbought bull trend
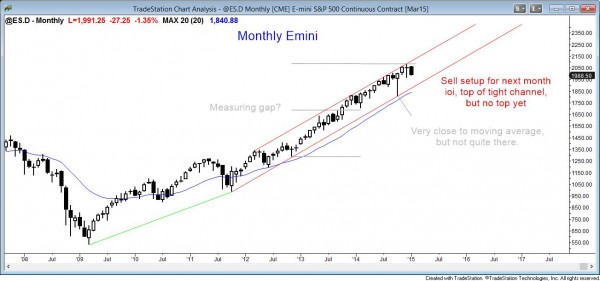
The monthly Emini candle chart formed an ioi setup with this month’s close on Friday. Since the monthly candle chart is overbought and at the top of the channel, this bear signal bar increases the chances of a profitable short on a breakout below the January low.
The monthly S&P500 Emini candle chart finally created a credible sell signal bar with January’s close near its low. This is an ioi sell setup. January is an inside bar, and December was an outside bar. This is a breakout mode setup, which means that the breakout can be up or down. Since the monthly chart is so extremely overbought and it is at the top of the monthly channel and at a measured move target, the odds of a bear breakout in February are greater than the odds of a bull breakout. Because the monthly chart is in a strong bull trend, the chance of February being the start of a bear trend are small. However, a 20% pullback is likely at some point this year, so traders are paying attention to every reversal down and every sell setup.
Traders trading the monthly chart will look to sell on a stop at one tick below this month’s low. Since the Emini ended the month near its low, that sell signal could trigger on Monday. It could also come on a gap down during the coming week. This is especially true because the daily chart is in a tight trading range and the breakout can be sudden and big, and a big gap often comes at the start of a trend.
Although the monthly chart is strongly bullish, this is a credible sell signal. Most sell signals in bull trends evolve into bull flags. However, even if the monthly chart fell to the moving average, which it almost certainly will at some point this year after not touching it for 30 bars, that 200 – 400 point drop would still be simply a pullback on the monthly chart. A 400 point drop would be a bear trend on the daily chart and either a bear trend or a big trading range on the weekly chart, but it would be a simple pullback on the monthly chart.
Since it would be the first pullback in over 20 bars, it would be a 20 gap bar buy setup…there has been a gap between the low of every bar and the moving average for more than 20 bars. The odds are that the monthly bulls will look to buy a pullback to below the moving average.
Weekly S&P500 Emini candle chart: First close below moving average
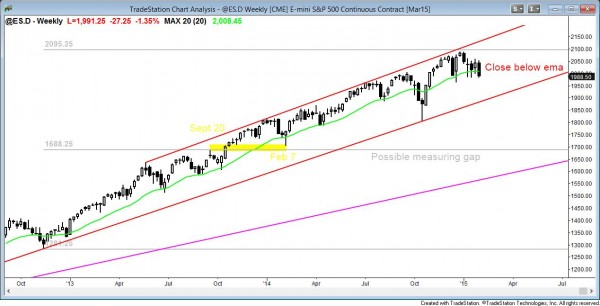
The weekly Emini candle chart has been in a tight trading range just above the 20 week ema, but it has not been reversing up strongly. There was finally a close below the moving average this week
The weekly S&P500 Emini candle chart has been holding above the moving average for the past 2 months, but the reversals up have not gone far and the bars have not been strong bull reversal bars. This week had the first close below the moving average. Although the Emini is still within its 3 month trading range, bears will begin to short if there is a breakout below the trading range. The breakout can be a single big bear trend bar or a series of several smaller bear bars closing on their lows. If either happens, traders will see the weekly chart as always in short and they will sell closes and sell above bars, expecting at least two legs down. This has not yet happened and the weekly chart is still always in long, but it could quickly reverse down. The context is good for the bears and they are ready to short.
Daily S&P500 Emini candle chart: Tight trading range so breakout mode
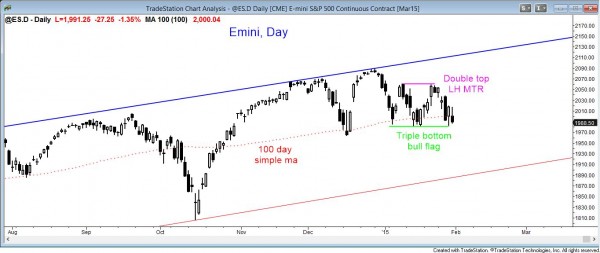
The daily Emini candle chart is in a tight trading range, with a triple bottom bull flag and a double top lower high major trend reversal. There is no breakout yet, but this is breakout mode and a breakout in either direction is imminent. The breakout will then try to reach at least a measured move, based on the height of the trading range.
The daily S&P500 Emini candle chart is in a tight trading range that is within a 3 month trading range. Some traders see the range as beginning last spring. It is in breakout mode. The bulls see a triple bottom bull flag and hope for trend resumption up. The bears see a double top lower high major trend reversal and are hoping for a bear breakout and at least a measured move down. Although the selling pressure is building and the context on the monthly and weekly charts are supportive of a bear trend, the bears still need the bear breakout and follow-through. Until then, the daily chart is still always in long.
Since there is now a monthly sell signal, the Emini can trigger a sell signal by trading below January’s low. With the trading range on the daily chart as tight as it is, the short can be triggered with a gap down on Monday or any day next week. Most gaps do not lead to trends, but most trends have either an early gap or a big breakout bar. The context is good for the bears and they are ready to sell if they get their breakout. Until they do, the daily chart is still always in long and the bulls still have a slight advantage.
Every bar that gets added to the trading range reduces that edge and at some point, the chance of the bear breakout becomes equal to that for the bull breakout. The Emini is very close to that now. Be ready to short, but always be respectful of the institutions who hold the opposite view, and be ready to buy if there is instead a strong bull breakout.
Traders can see the end of the day bar-by-bar price action report by signing up for free at BrooksPriceAction.com. I talk about the detailed Emini price action real-time throughout the day in the BrooksPriceAction.com trading room, and a 2 day free trial is available.
When I mention time, it is USA Pacific Standard Time (the Emini day session opens at 6:30 am PST, and closes at 1:15 pm PST). You can read background information on the intraday market reports on the Intraday Market Update page.


