Market Overview: S&P 500 Emini Futures
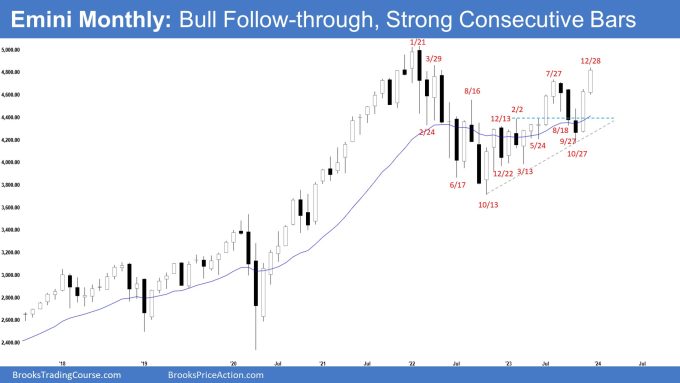
The monthly chart formed an Emini strong consecutive bull bars closing above the July 27 high. The next target for the bulls is the all-time high. They will need to create a follow-through bull bar in January to increase the odds of a breakout above the all-time high. The bears want a reversal from a lower high major trend reversal or a double top and a large wedge pattern (Dec 2, July 27, and Dec 28).
S&P500 Emini futures
The Monthly Emini chart

- The December monthly Emini candlestick was a consecutive bull bar closing near its high and above the July 27 high.
- Last month, we said that the bull trend remains intact. If the bulls get a follow-through bull bar closing above the July 27 high, it will increase the odds of a retest of the all-time high.
- The bears see the current rally as a retest of the March 2022 all-time high and want a reversal from a lower high major trend reversal or a double top.
- They also see a large wedge pattern (Dec 2, July 27, and Dec 28).
- They want a larger second leg down (with the first leg being Jan 2022 to October 2022 selloff) and a retest of the October 2022 low.
- Because of the strong rally in November and December, they will need a strong signal bar or a micro double top before traders would be willing to sell more aggressively.
- Previously, the bulls managed to create a tight bull channel from March to July.
- That increases the odds of at least a small second leg sideways to up after the July to October pullback. The second leg up is currently underway.
- They hope that the current rally will lead to a multi-month rally, like the rally from November 2020.
- Since December closed above the July 27 high, the bulls will need to create a follow-through bull bar in January to increase the odds of a breakout above the all-time high.
- They hope to get a gap up on the Yearly, Monthly, Weekly and Daily charts when trading resumes next week. Small gaps usually close early.
- December is a bull bar closing near its high, so it is a buy signal bar for January.
- For now, odds slightly favor January to trade at least a little higher. The all-time high is close enough and could be tested in January.
- The bull trend remains intact (higher highs, higher lows).
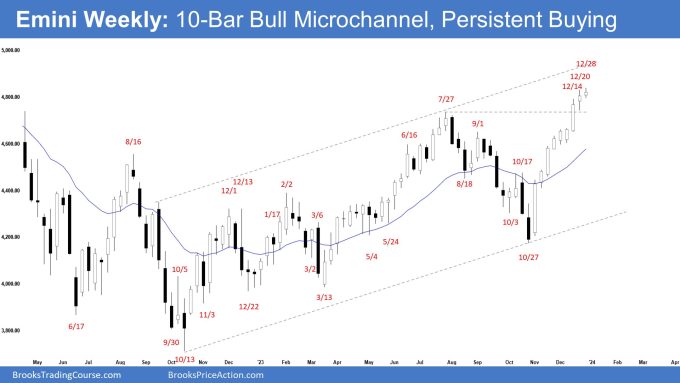
The Weekly S&P 500 Emini chart

- This week’s Emini candlestick was a bull doji closing slightly below the middle of its range.
- Last week, we said that until the bears can create strong consecutive bear bars, odds continue to favor the market to remain in the sideways to up phase. Traders will see if the bulls can get another follow-through bull bar (even if it is just a bull doji).
- This week was another consecutive bull bar (a small bull doji).
- The bulls got a strong rally in the form of a 10-bar bull microchannel with bull bars closing near their highs. That means strong bulls.
- The next target for the bulls is the all-time high. They want a strong breakout into new all-time high territory, hoping that it will lead to many months of sideways to up trading.
- There likely will be buyers below the first pullback from such a strong bull microchannel.
- If a two-legged pullback begins, the bulls want it to be sideways and shallow, with doji(s), bull bars and overlapping candlesticks with long tails below.
- If there is a deep pullback, they want a second leg sideways to up and the 20-week EMA to act as support.
- The bulls want a gap up on the Yearly, Monthly, Weekly and Daily chart. Small gaps usually close early.
- The bears hope that the strong move is simply a buy-vacuum test of what they believe to be a 37-month trading range high.
- They want a reversal from a higher high major trend reversal (with the July 27 high) or a lower high major trend reversal (with the all-time high).
- They also see a large wedge forming (Feb 2, July 27, and December 28) and a micro wedge (Dec 14, Dec 20, and Dec 28).
- The problem with the bear’s case is that the rally is very strong.
- They will need to create strong bear bars with sustained follow-through selling to increase the odds of a deeper pullback.
- Since this week’s candlestick is a bull doji closing neat its midpoint, it is a neutral signal bar for next week.
- The risk for new buyers is big because of the large stop required. Swing bulls (with positions established at lower prices) will likely continue to hold through the anticipated pullback, believing it will be minor.
- Traders see the overbought conditions and are anticipating a pullback. However, the pullback never seems to arrive.
- Sometimes, such a move ends (and the pullback phase begins) with a climactic spike that is parabolic with the capitulation of the bears, typically forming one of the largest candlesticks in the move up.
- If a two-legged pullback begins, traders will see the strength of the pullback, whether it is deep and strong, or sideways and shallow (with doji(s), bull bars and candlesticks with long tails below).
- Because of the strong bull spike (10-bar bull microchannel), there may be buyers below the first pullback.
- Until the bears can create strong consecutive bear bars or a big reversal bar, odds continue to favor the market to remain in the sideways to up phase.
Trading room
Al Brooks and other presenters talk about the detailed Emini price action real-time each day in the BrooksPriceAction.com trading room. We offer a 2 day free trial.
Market analysis reports archive
You can access all weekend reports on the Market Analysis page.

