Market Overview: S&P 500 Emini Futures
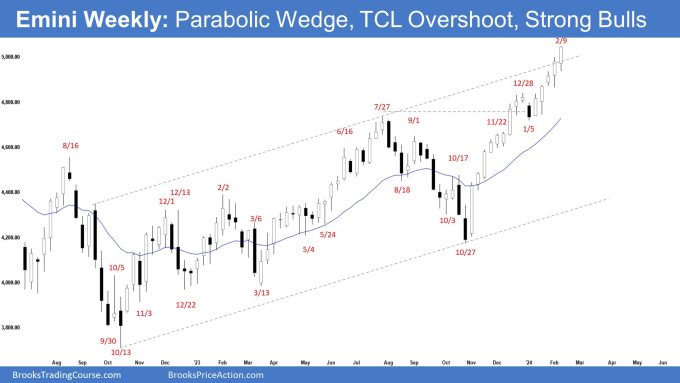
The weekly chart is in a tight bull channel which means strong bull, but it is also forming an Emini parabolic wedge (Nov 22, Dec 28, and Feb 9). The bulls need to continue creating follow-through buying above the all-time high. The bears want a reversal from a double top (with the all-time high) and a large wedge pattern (Feb 2, July 27, and Feb 9).
S&P500 Emini futures
The Weekly S&P 500 Emini chart

- This week’s Emini candlestick was another follow-through bull bar closing near its high and above the trend channel line.
- Last week, we said that while the market continues to be Always In Long, the rally has lasted a long time and is slightly climactic. Traders expect a minor pullback and are looking for signs of this.
- This week tested and closed above the all-time high.
- The bulls continue to get follow-through buying in a tight bull channel. That means strong bulls.
- They want a strong breakout into a new all-time high territory, hoping that it will lead to many months of sideways to up trading.
- Swing bulls would continue to hold their long position established at lower prices believing any pullback likely to be minor and the market has transitioned into a bull channel phase.
- The bears hope that the strong rally is simply a buy-vacuum test of what they believe to be a 38-month trading range high.
- They want a reversal from a double top (with the all-time high) and a large wedge pattern (Feb 2, July 27, and Feb 9). They want a failed breakout above the all-time high and the trend channel line.
- They also see a parabolic wedge in the third leg up since October (Nov 22, Dec 28, and Feb 9).
- They hope to get at least a TBTL (Ten Bars, Two Legs) pullback.
- The problem with the bear’s case is that the rally is very strong. The only bear bar in the rally had no follow-through selling.
- They would need a strong reversal bar, a micro double top or a reasonable signal bar before traders would think to sell aggressively.
- Since this week’s candlestick is a bull bar closing near its high, it is a buy signal bar for next week.
- The market may gap up on Monday. Small gaps usually close early. A gap late in a trend often becomes an exhaustion gap.
- Traders will see if the bull can create another follow-through bull bar and resume the move higher. Or will the market stall around the all-time high area?
- While the market continues to be Always In Long, the rally has lasted a long time and is slightly climactic.
- Traders expect a minor pullback and are looking for signs of this. So far, there are none yet.
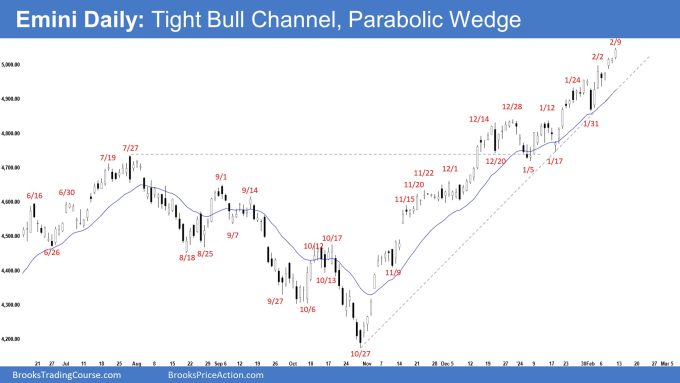
The Daily S&P 500 Emini chart

- The market traded sideways to up for the week, breaking above the all-time high.
- Previously, we said that odds slightly favor the market to still be Always In Long. Traders will see if the bulls can continue to create sustained follow-through buying to reach the previous all-time high.
- This week tested the all-time high. The bulls got what they wanted.
- They got the third leg up from a double bottom bull flag (Jan 5 and Jan 17) or a wedge bull flag (Dec 20, Jan 5, and Jan 17).
- They hope that the current rally will form a spike and channel which will last for many months after the recent pullback (in Jan).
- They want a strong breakout above the all-time high with follow-through buying.
- If there is a deeper pullback, the bulls want at least a small sideways to up leg to retest the current trend extreme high (now Feb 9).
- The bears hope that the strong rally is simply a buy vacuum retest of the all-time high.
- They want a reversal down from a double top (with the all-time high), a large wedge pattern (Feb 2, July 27, and Feb 9) and a parabolic wedge (Nov 22, Dec 28, and Feb 9).
- If the market continues higher, the bears want a failed breakout above the all-time high.
- The bears will need to create consecutive bear bars closing near their lows and trading far below the 20-day EMA and the bear trend line to increase the odds of a deeper pullback.
- For now, the buying pressure remains stronger (tight bull channel, small pullback) as compared with the selling pressure (e.g., weaker bear bars with no follow-through selling).
- Friday was a bull bar closing near its high. The market may gap up on Monday. Small gaps usually close early.
- Gaps late in a trend may turn out to be exhaustion gaps, rather than a new breakout or a measuring gap.
- Odds slightly favor the market to still be Always In Long.
- However, the rally has lasted a long time and is slightly climactic.
- While there are no signs of selling pressure yet, traders should be prepared for a minor pullback which can begin within a few weeks.
- Traders will see if the bulls can continue to create sustained follow-through buying above the all-time high or not.
Trading room
Al Brooks and other presenters talk about the detailed Emini price action real-time each day in the BrooksPriceAction.com trading room. We offer a 2 day free trial.
Market analysis reports archive
You can access all weekend reports on the Market Analysis page.

