Monthly S&P500 Emini futures candlestick chart: Learn how to trade candlestick patterns with weak price action
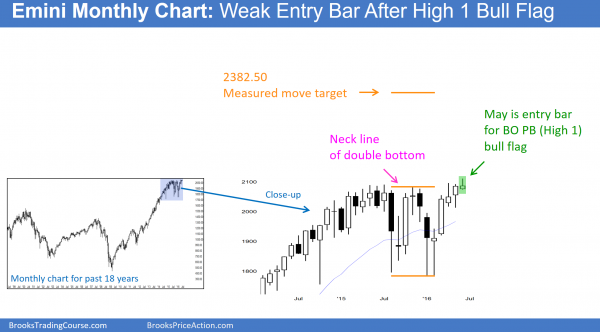
The monthly S&P500 Emini futures candlestick chart is breaking above the top of a 2 year trading range in an overbought bull trend.
The monthly S&P500 Emini futures candlestick chart is breaking above a 2 year trading range.The odds of a measured move up based on the 300 point height of the trading range are 40%. If the breakout gets much stronger, the odds will go up. It is more likely that the breakout will fail before reaching the target. The Emini would then reverse back down into the 2 year range, which would be the Final Bull Flag after an 8 year buy climax. If the bears reverse the Emini to below the Final Flag, the target for the bears would be based on the 300 point height of the 3 year trading range, which means down to the 1500 area.
The range of this month is small and it follows 2 doji candlestick patters. This is not the way a strong bull breakout typically behaves, and it increases the chances that the breakout will fail.
Weekly S&P500 Emini futures candlestick chart: Failed breakout to a new all-time high
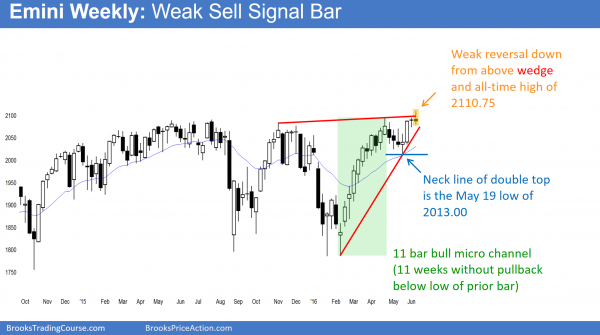
The weekly S&P500 Emini futures candlestick chart had a weak sell signal bar this week after breaking out to a new all-time high. Because the wedge top does not have good proportions, most computers will ignore it.
The weekly S&P500 Emini futures candlestick chart had an 11 week bull micro channel that began in February. A micro channel that is protracted like that is a buy climax, and it is usually followed by a 1 – 3 bar pullback, a 1 – 3 bar rally to a new high, and then a trading range. This week might be the top of the trading range.
A logical bottom is the low of the pullback from the micro channel. That is the May 19 low of 2013.00, which is almost 100 points below this week’s all-time high. There is a 60% chance that the bears will succeed in testing this target over then next month or two. Because the sell signal bar is not strong and trading range tops and bottoms are never clear, there might be another small leg up before the reversal down begins.
There is always a bull case, and bulls are hoping for a successful breakout above the 2 year trading range and a 300 point measured move up. The see the May pullback as a Cup and Handle pullback where the January selloff and February rally form the cup. Trading ranges always have bull and bear patterns, but are very resistant to breaking out. This means that this breakout will probably fail, just like all of the other strong bull and bear breakout attempts over the past 2 years.
As a breakout is underway in a trading range, it always looks like it will finally be the one that succeeds. CNBC puts on “experts” who are bullish when there is a breakout attempt near the top, and bearish when there is an attempt at a bear breakout. They are wrong 80% of the time, which is due to my inertia rule (80% of trading range breakouts fail, and 80% of trend reversal attempts fail). It is far easier to make money betting with the probabilities than with the well-dressed, highly credentialed idiots that you see on T.V.
This week’s bear reversal bar was small and had a tail below. This is not a strong sell signal bar, especially since it is the second doji bar in a row. Doji bars are one bar trading ranges and are a sign that the market is satisfied with the current price. They are not common at major reversals or breakouts. This is consistent with what I said about the micro channel buy climax. The odds are that the weekly chart will go sideways for at least several more weeks, even if it goes a little higher first.
The Emini can suddenly decide at any time that the price is grossly wrong. For example, next week’s FOMC announcement or any Fed announcement or major news event can lead to a rapid repricing up or down. It does so with a big trend bar and usually a series of trend bars, and the race to the new fair price can last for many bars.
There is no evidence that a breakout up or down is about to happen, but there is a FOMC meeting this week, and then another in July. I never care what the Fed says or does, and I absolutely never care about the pundits on TV who do not know how to trade. All I care about is whether the market goes up or down. I am in this to make money in an enjoyable way and the best way to do it is to watch the charts and do the obvious. If the Emini is going up strongly, I will buy. It can go up strongly whether the Fed raises interest rates or keeps them unchanged. It can also go down strongly in either case. I want to focus on the price action.
Listening to the experts on TV is usually an attempt to absolve yourself of your personal responsibility for making money. As a trader, you eat what you kill, and you are not going eat unless you hunt. Watching someone else hunt is not enough. You have to do the hard work yourself. You have to develop the skills and the confidence, and a pundit on TV is not going to help you once his 2 minutes of airtime are over.
When a market is in a trading range, nothing is ever very clear because neither the bulls nor the bears stay in control for long. This week’s top is not strong. The probability for the bears is higher if they wait for a second entry short or a strong bear breakout. If next week goes below last week’s low, that is a 1st entry. If the weekly chart reverses back up within a couple of week’s, but then reverses down again, that is a 2nd signal. Second signals at the top and bottom of a trading range have a higher probability of being profitable.
Daily S&P500 Emini futures candlestick chart: Minor reversal
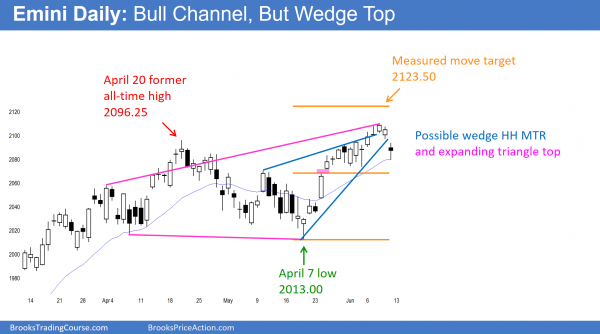
The daily S&P500 Emini futures candlestick chart gapped below a bear trend line, but there was only one bear day in the prior 13 days. Sideways is more likely than down.
The daily S&P500 Emini futures candlestick chart had a gap down on Friday. This triggered a sell signal on the daily chart for a failed breakout to a new all-time high, a break below a wedge higher high major trend reversal, and a reversal down from an expanding triangle top. This sounds like a lot of reasons for a bear trend. However, this is an opportunity to earn how to trade candlestick patterns with weak price action.
However, prior to today, there was only one bear bar in the prior 13 days. This means that there is very little selling pressure. A reversal down when there are so many bull bars is likely to not fall far. A big bear breakout can happen at any time, like with this coming week’s Fed announcement. However, the daily chart is telling traders that the bears probably need more evidence of a top.
If the Emini trades up on Monday or Tuesday, it might then form a micro double top with the all-time high of the past week. That would increase the chance of a reversal down. However, the odds are against a lot of follow-through selling on Monday or Tuesday. As you read above, there is a 60% chance of about a 100 point pullback over the next month or two. Next Wednesday’s Fed announcement might be the start of the selloff. At the moment, this top on the daily chart is coming in the presence of too many bull bars and that makes sideways more likely than down for at least a couple of days.
The cash index came to within 14 points of its all-time high this week. It might be close enough to the magnet of that resistance so that it will not be able to resist the magnetic pull. If the cash index rallies 14 points above the high of the past week, the Emini will as well. It does not matter if the cash index forms a perfect double top with last year’s all-time high or turns down from slightly above or below. What matters is whether it turns down or breaks strongly to the upside.
Since most trading range breakouts fail, and the current attempt over the past couple of weeks has been weak, the odds are that this attempt will fail. If it does, the Emini will then test support, like the May low or, less likely, the February low.
Traders can see the end of the day bar-by-bar price action report by signing up for free at BrooksPriceAction.com. I talk about the detailed Emini price action real-time throughout the day in the BrooksPriceAction.com trading room, and a 2 day free trial is available.
When I mention time, it is USA Pacific Standard Time (the Emini day session opens at 6:30 am PST, and closes at 1:15 pm PST). You can read background information on the intraday market reports on the Intraday Market Update page.


