Market Overview: Bitcoin Futures
Bitcoin futures traded down during November, with Bitcoin testing major breakout point. Current prices are attractive for traders because of the importance of the price levels that are around.
Bitcoin futures
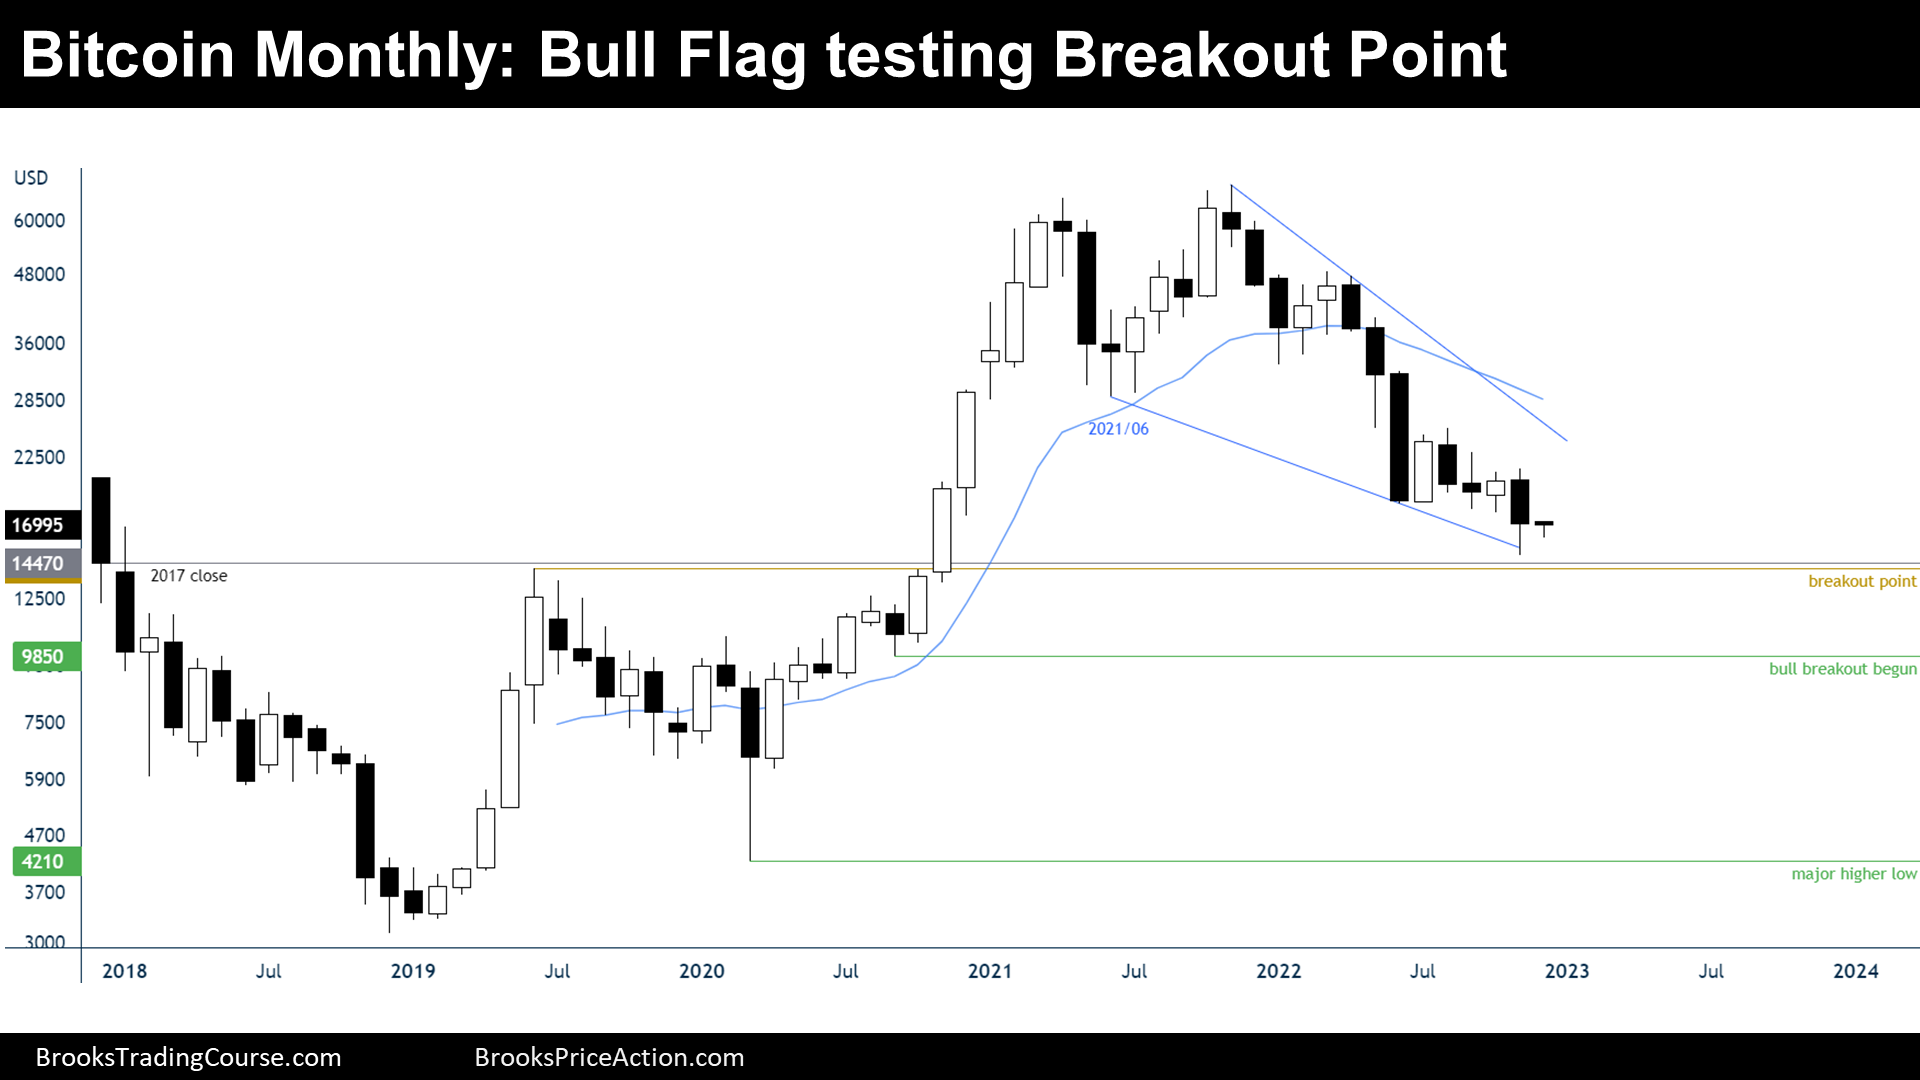
The logarithmic Monthly chart of Bitcoin futures

- This monthly candlestick is a bear bar closing below its midpoint with a large tail below its close.
- November traded above October, triggering a High 3 bull flag, and then it reversed down, achieving a new low for the year.
- During the prior monthly report, I have said that I was expecting higher prices during the rest of the year, but the price did the opposite. However, I have also said that what I expect for bitcoin during the following years is a major trading range between $14470 and $69355. I was anticipating a test at the 2017 close & the major breakout point at some point.
- Looking at the monthly logarithmic chart allows us to observe clearer the context, a bull flag pattern that is testing the major breakout point.
- Also, we can see that the bear leg within the bull flag is tight; hence, the first reversal up will be probably minor. Actually, we have been insisting on the fact that there are trapped bulls at the 06/2021 low; therefore, selling pressure is expected during any reversal up; we should expect another test of the lows after any attempt to reverse the trend up.
- Bears are still in control in lower timeframes; if the price keep trending down, the long-term bull trend will be viewed as technically over, by most traders, at $9850, which is the price where the major bull trend begun.
- In conclusion, the long-term context will favor the bulls until the major bull trend becomes technically over. Traders should expect a bull leg starting soon, up to the 06/2021 low.
- November is either a weak sell or buy signal bar. Probably, there will be buyers below. Because the price closed around its midpoint, December might end up being an inside bar.
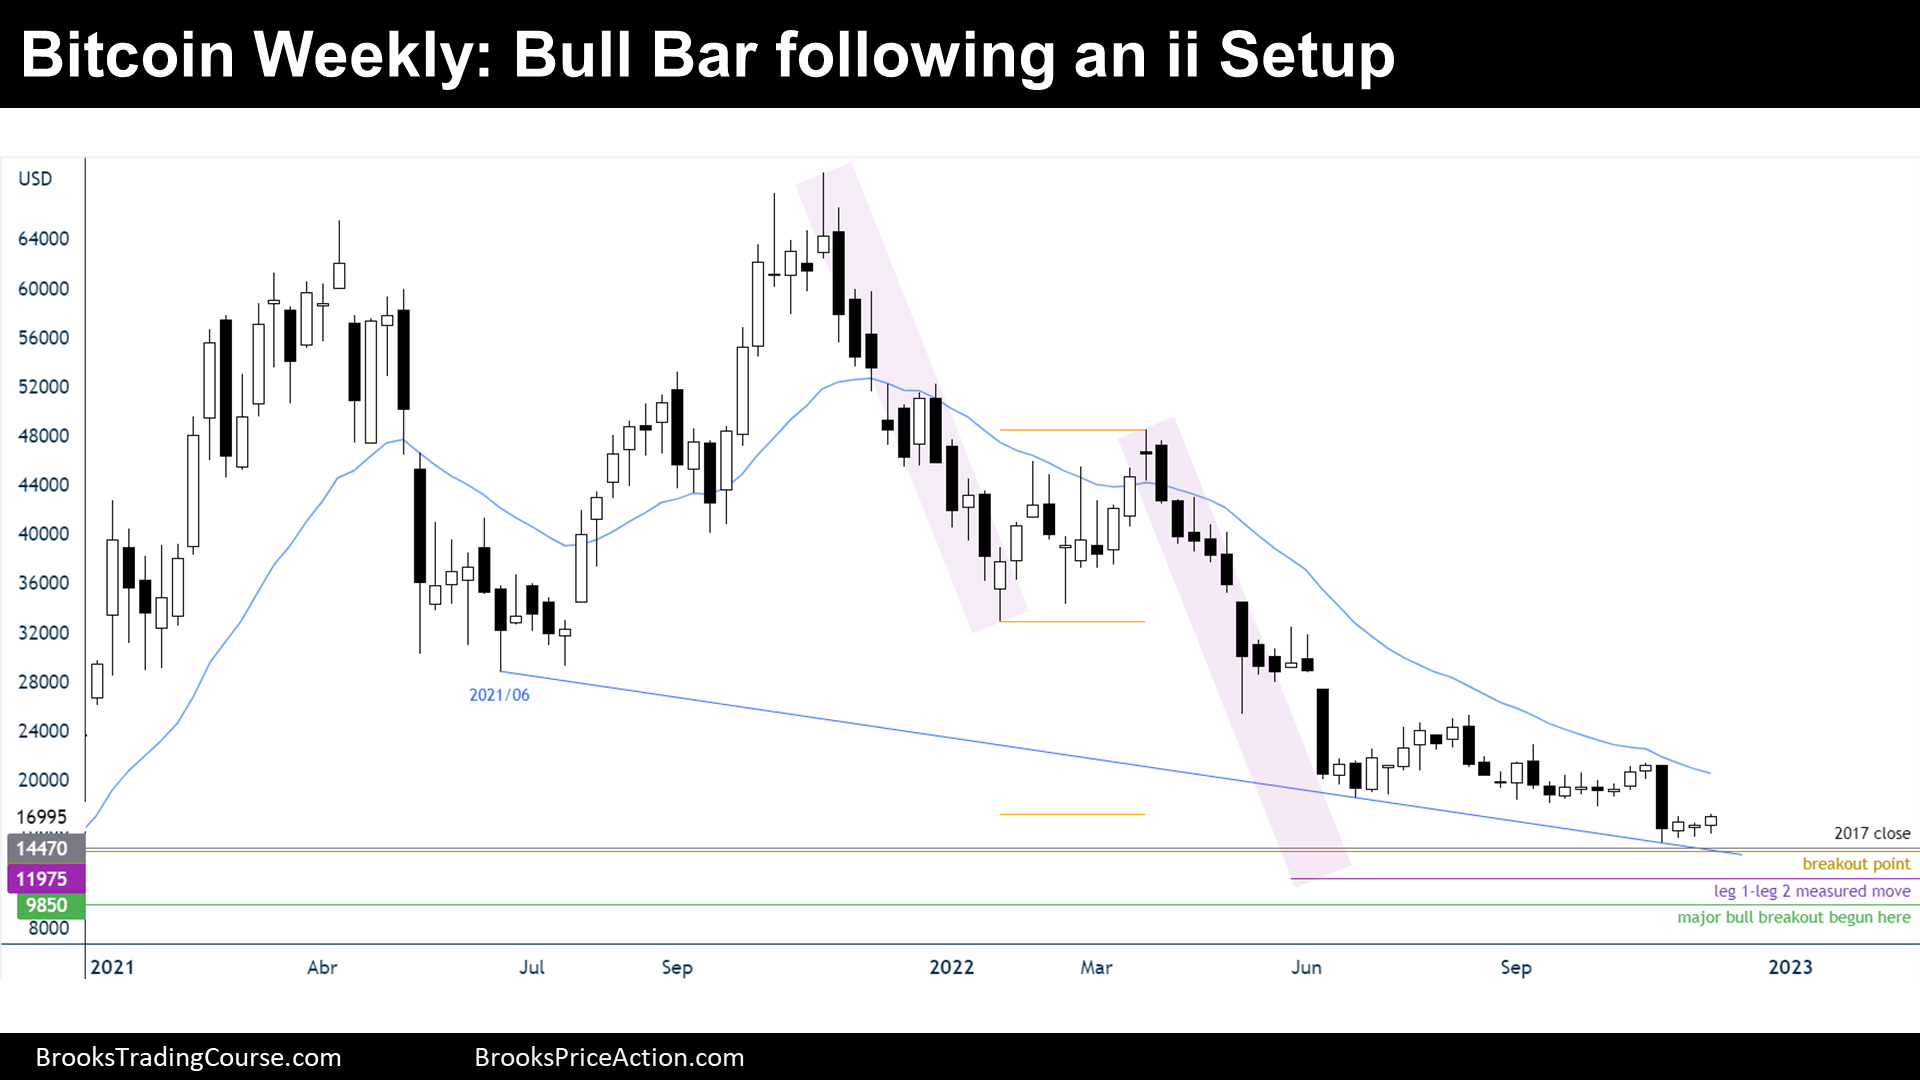
The Weekly chart of Bitcoin futures

- This week’s candlestick is a bull bar following an ii pattern. The ii pattern comes after a bear flag late in a trend; hence, bulls that bought above the ii pattern were betting on a final flag setup.
- During the past report, I have said that the price could experience a rapid move to test the October low.
- The bulls want a reversal up from here and get back to the apex of the final flag.
- The bears want the bulls to fail and continue the trend down until they reach their ultimate targets which are between $11975 and $9850.
- Price still within a bear channel, but the bear channel already has two strong bear legs; for traders it is hard to sell here because they feel that they are entering late. Therefore, it is more reasonable to expect the bears to sell higher.
- If the trend continues down, it means that the bulls are not buying, that the bears are not taking profits, or both things. However, because the price sits at a long-term support, and we are likely late in a bear trend. It is easier to expect the contrary: bulls buying and bears taking profits.
- Will this be the end of the bear trend? It is possible; however, traders will not consider that the trend is over until it reaches the prior major lower high at $25270.
- Traders think that the price is being moved by a bull setup, but they won’t be surprised if there is a new low because that is what happened every time that bulls tried something similar this year.
- $14000 area might act as a magnet and the price might have to go there before reaching the major lower high. However, because the final flag bull setup has not failed yet, we should expect higher prices during the next week.
Market analysis reports archive
You can access all weekend reports on the Market Analysis page.

