Market Overview: Bitcoin Futures
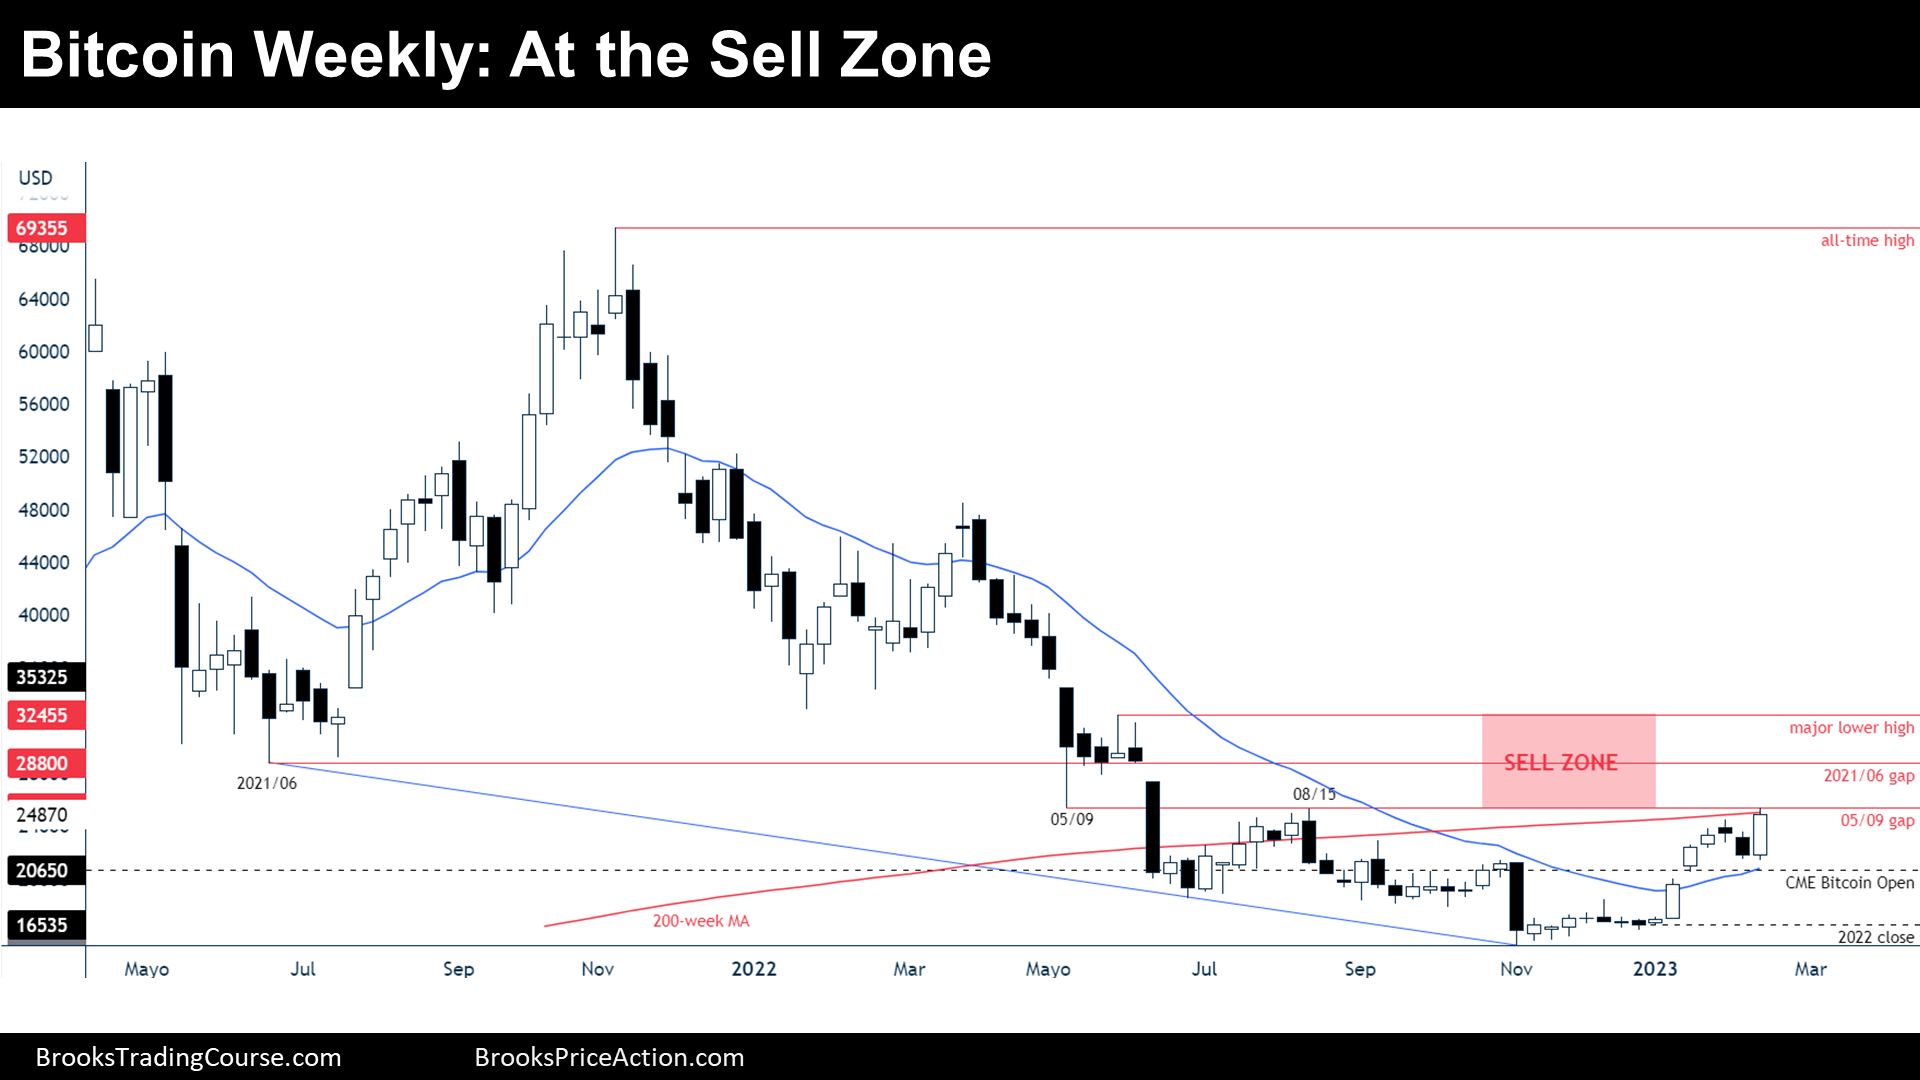
Bitcoin entering sell zone. During this week, the price increased by +14.21% of its value. Traders should expect a leg sideways to down testing 2022 lows starting within the next months.
Bitcoin futures
The Weekly chart of Bitcoin futures

Analysis
- This weekly candlestick bar is an outside up bar closing around its high.
- On the previous report, we have said that a good follow through for the bears was not expected.
- Presently, the price is facing a confluence of resistances:
- 9th May low gap.
- 15th August high.
- 200-week moving average (200-week MA).
- $25000 big round number.
- Above current prices, there is the gap of June 2021 low: there, some long-term bulls may be trapped into longs and therefore, they will sell if the price gets there, adding selling pressure.
- We have been saying since June 2022 that the overall context is a trading range instead of a bear trend.
- It is fair to assume that the overall context is a trading range instead of a bull major trend reversal.
- During trading ranges, price tend to test highs and lows; however, traders should expect that breakouts attempts are going to fail most of the time.
- Another crucial aspect of the overall context, is that the bear channel was strong enough to expect the first reversal up to fail. Currently, the price is experiencing the first reversal up.
- The price is either:
- Bull case: the most likely scenario is a trading range, but bulls hope that in the future the current prices will be the buy zone of that trading range. They think that because trading ranges tend to close important gaps, it will close the gap with the major lower high: that is the potential top of the expected trading range.
- Bear case: the price is facing a cluster of resistances after a first reversal upcoming after a strong bear channel; hence, they expect a leg down starting anytime now, with the objective to test the 2022 lows. They see a double top with 15th August high.
- Because the price is facing strong resistances and entering a sell zone, we should expect a bear leg starting soon.
Trading
- Bulls: They might prefer buying low or after a breakout of the resistances, or if they feel like a small pullback bull trend is forming. For now, there is nothing of that on this chart.
- Bears: They probably own the odds now. Some will directly sell at the 200-week MA. Others, might wait to sell a bear bar closing on its low of a double top with 15th August high.
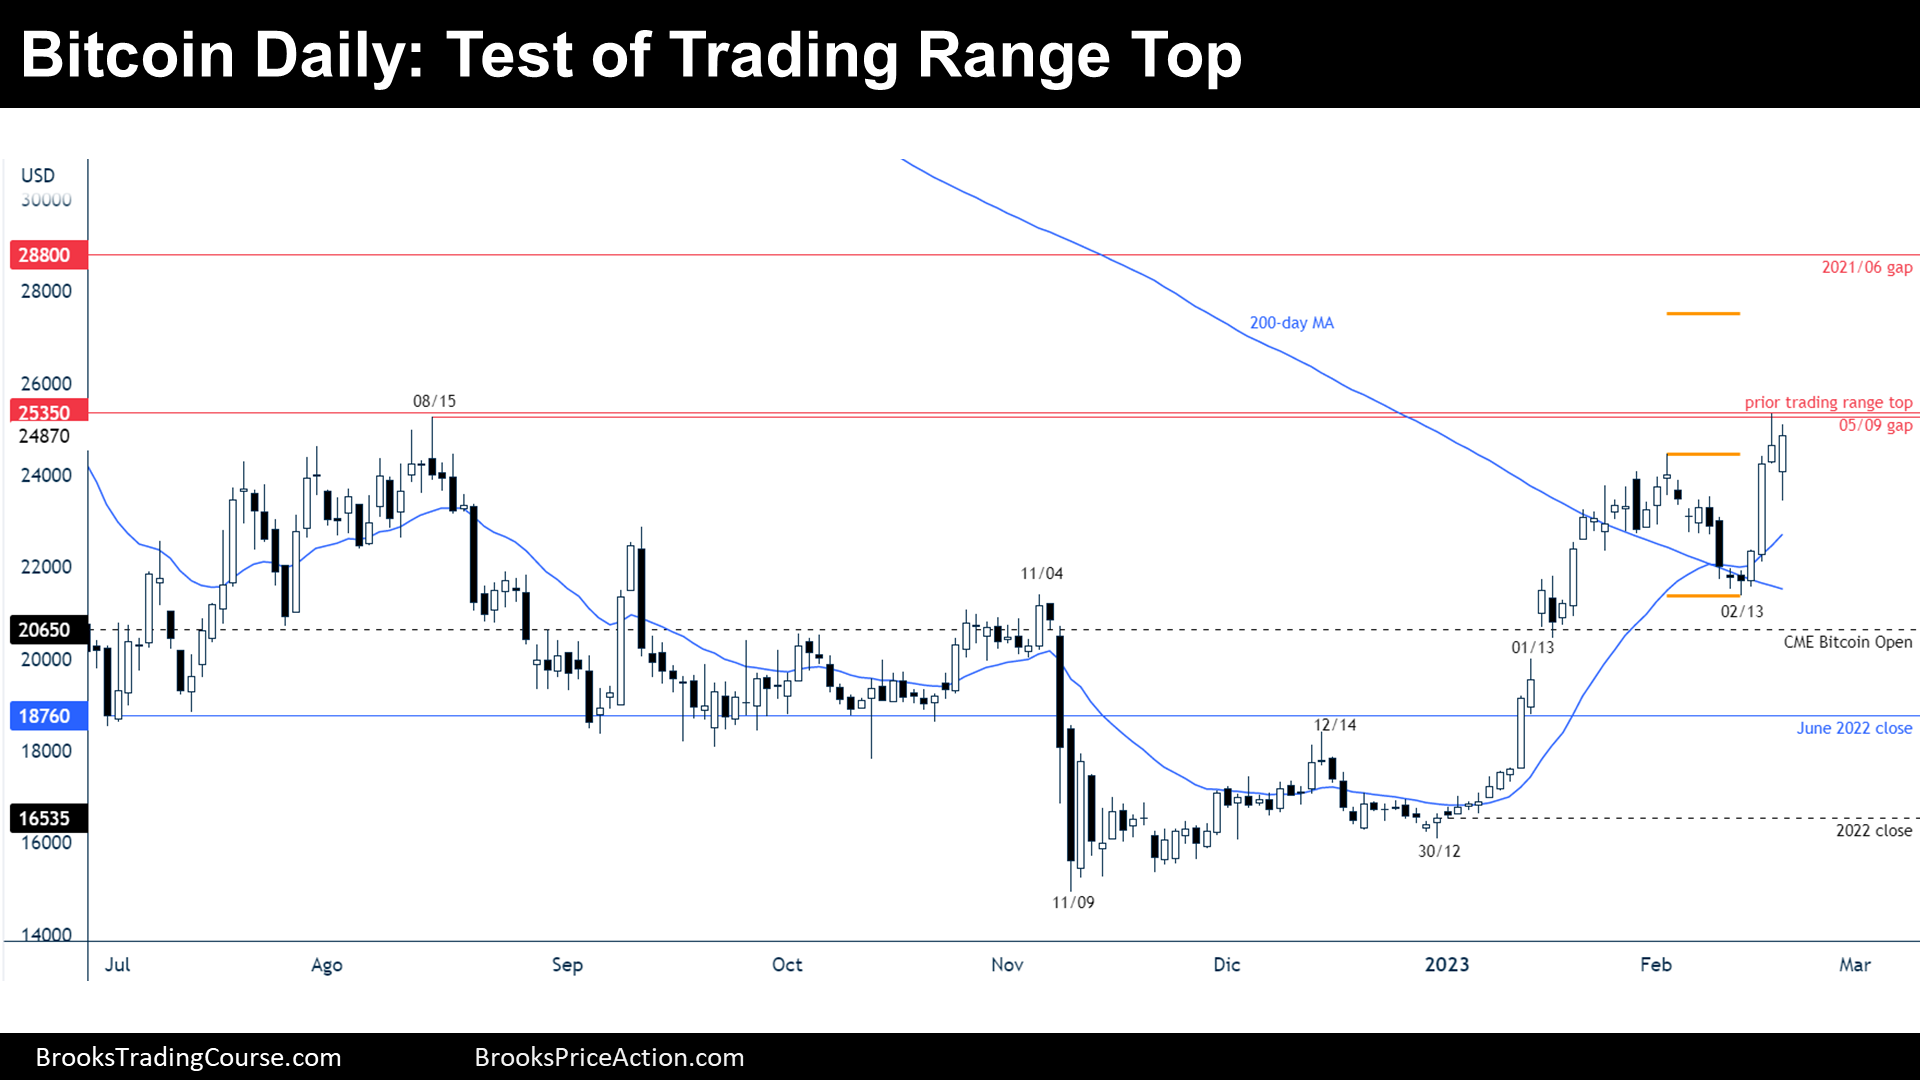
The Daily chart of Bitcoin futures

Analysis
- Last week, we have said that bulls were likely buying at the supports of the 200-day MA and the 20-day exponential moving average (20-day EMA). We have said that other bulls might wait for a bull bar emerging from there instead of buying with limit orders, like occurred on February 14th.
- Thereafter, a climatic bull rally did a test to the prior trading range top.
- Nowadays, the price is either:
- Bull case: The price is in a bull channel and subsequent higher lows and higher highs should be expected. Bulls want a measured move up of the failed bear breakout up to $27500.
- Bear case: The price is within a trading range, and most breakout attempts within a trading range fail. They think that a test of February 13th is underway.
Trading
- Bulls: It is hard to buy here, better they might want to buy a breakout of current resistances or after a retracement at support.
- Bears: Some bears might have sold above the top of the trading range betting that the breakout will fail. It is a good idea to look to short any bear setup as a Low 2 top, double top, or a reversal down, since the price is high on this chart and is facing resistances on higher time frames.
Market analysis reports archive
You can access all weekend reports on the Market Analysis page.

