Market Overview: Bitcoin
The Bitcoin price ascended to meet the 2022 High price magnet, trading upward as expected. However, the narrative took a sharp turn thereafter, with a formidable reversal that saw the price plummet by over $7500. This week’s weekly bar is a Bear Reversal bar, prompting the pivotal question: Has the market initiated the long-anticipated Bear Leg that traders have been on the lookout for?
This week, the SEC finally approved a Bitcoin ETF. The iShares Bitcoin Trust, with the ticker IBIT, opens up new avenues for investors to participate in the Bitcoin market through traditional financial channels. This development further legitimizes the role of Bitcoin in the broader financial landscape. Looking forward to seeing how this ETF contributes to the accessibility and acceptance of Bitcoin on a larger scale.
Bitcoin
The prices depicted on our charts are sourced from Coinbase’s Exchange Spot Price. It’s crucial to note that the spot price of Bitcoin is continuously in motion; trading activity never ceases. This means that market fluctuations and price changes occur around the clock, reflecting the dynamic nature of cryptocurrency trading.
The Weekly chart of Bitcoin

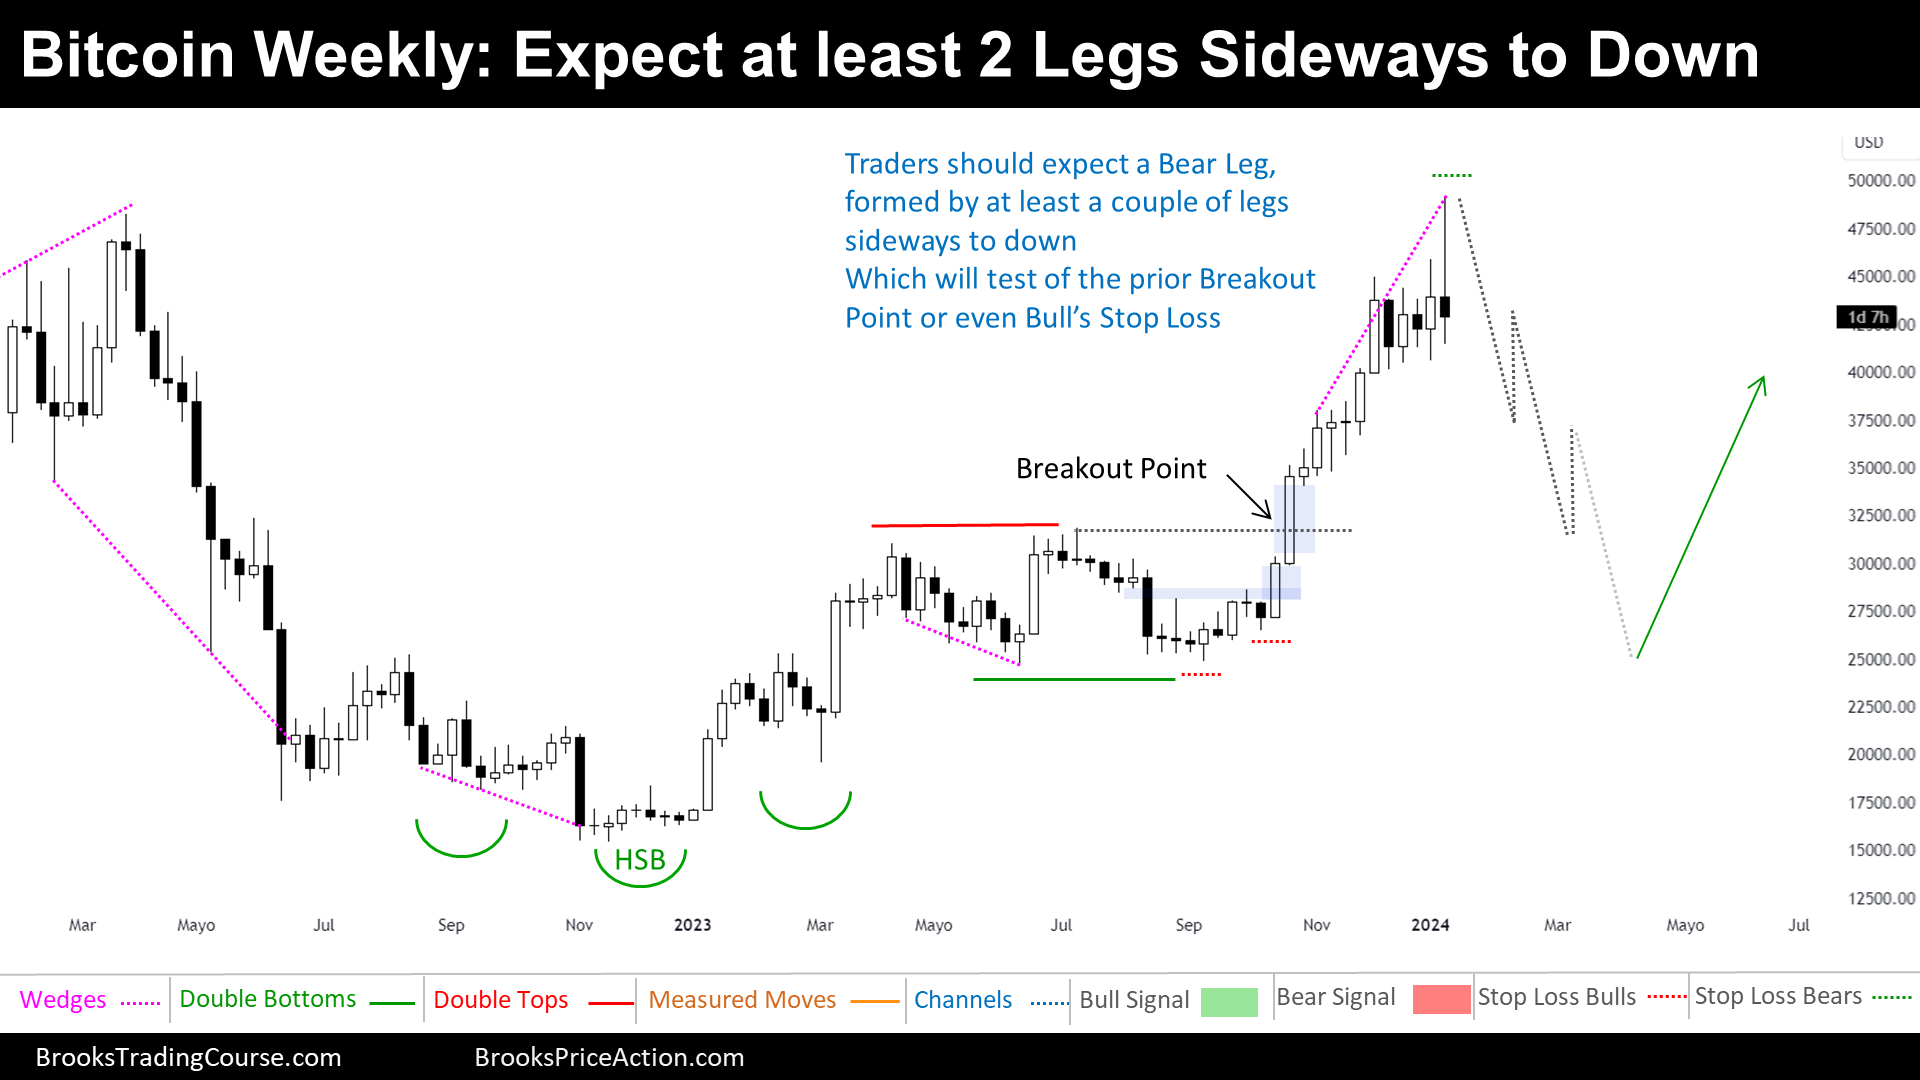
Bitcoin’s 2022 high proved to be a formidable magnet, in line with our expectations. The current scenario presents a sell zone above the 2024 high, and then, looking downwards, we start to find the supports in the form of Bull Micro Gaps, the 50% retracement level, and crucially, the Breakout Point and Major Higher Low.
The current Market Cycle appears to be a Trading Range because the price is Trading within a prior, and recent, price range. Until a decisive breakthrough above this range occurs, or until the traders forget what is on the left (long enough time) traders are advised to Trade under Trading Range dynamics conditions.
A Bull Leg in a Trading Range is typically succeeded by a Bear Leg. The current Bull Leg is exhausted, as the Parabolic Wedge Top denotes. Moreover, the Bulls achieved their key targets, like the 2022 High, all this points towards an impending Bear Leg.
The pivotal question arises: is the Bear Leg already in motion? More often than not, the price tends to retesting significant levels, the possibility of a surprise surge above the 2024 high persists. However, as we will see on the Daily Chart analysis, the Bears can confirm the Bear Leg thesis on the Weekly chart by a Bear Breakout of the Daily Range. Until then, any potential surge to a new high in 2024 should be approached cautiously, considering the likelihood of it being a Bull Trap.
Post a Parabolic Wedge Top, market dynamics often lead to a couple of Legs Sideways to Down. Bears target the Breakout Point, and potentially, the Major Higher Low, where Weak Bulls’ Stop Losses are situated. Traders need to brace for a gradual shift in market momentum, signifying the initiation of a Bear Leg.
Bitcoin’s current market state is intricately navigating a Trading Range, with historical indicators pointing towards an anticipated Bear Leg. While a future Leg Up is anticipated to test current highs, caution is paramount due to the evident exhaustion of the existing Bull Leg and the formation of a Parabolic Wedge Top. Traders must meticulously monitor the Daily Chart for a potential Bear Breakout, as this could significantly alter the market trajectory. Until such confirmation, a strategic stance involves anticipating a potential Bear Leg, comprehending the significance of prior price levels, and approaching any hypothetical new highs with a warranted level of skepticism.
The Daily chart of Bitcoin

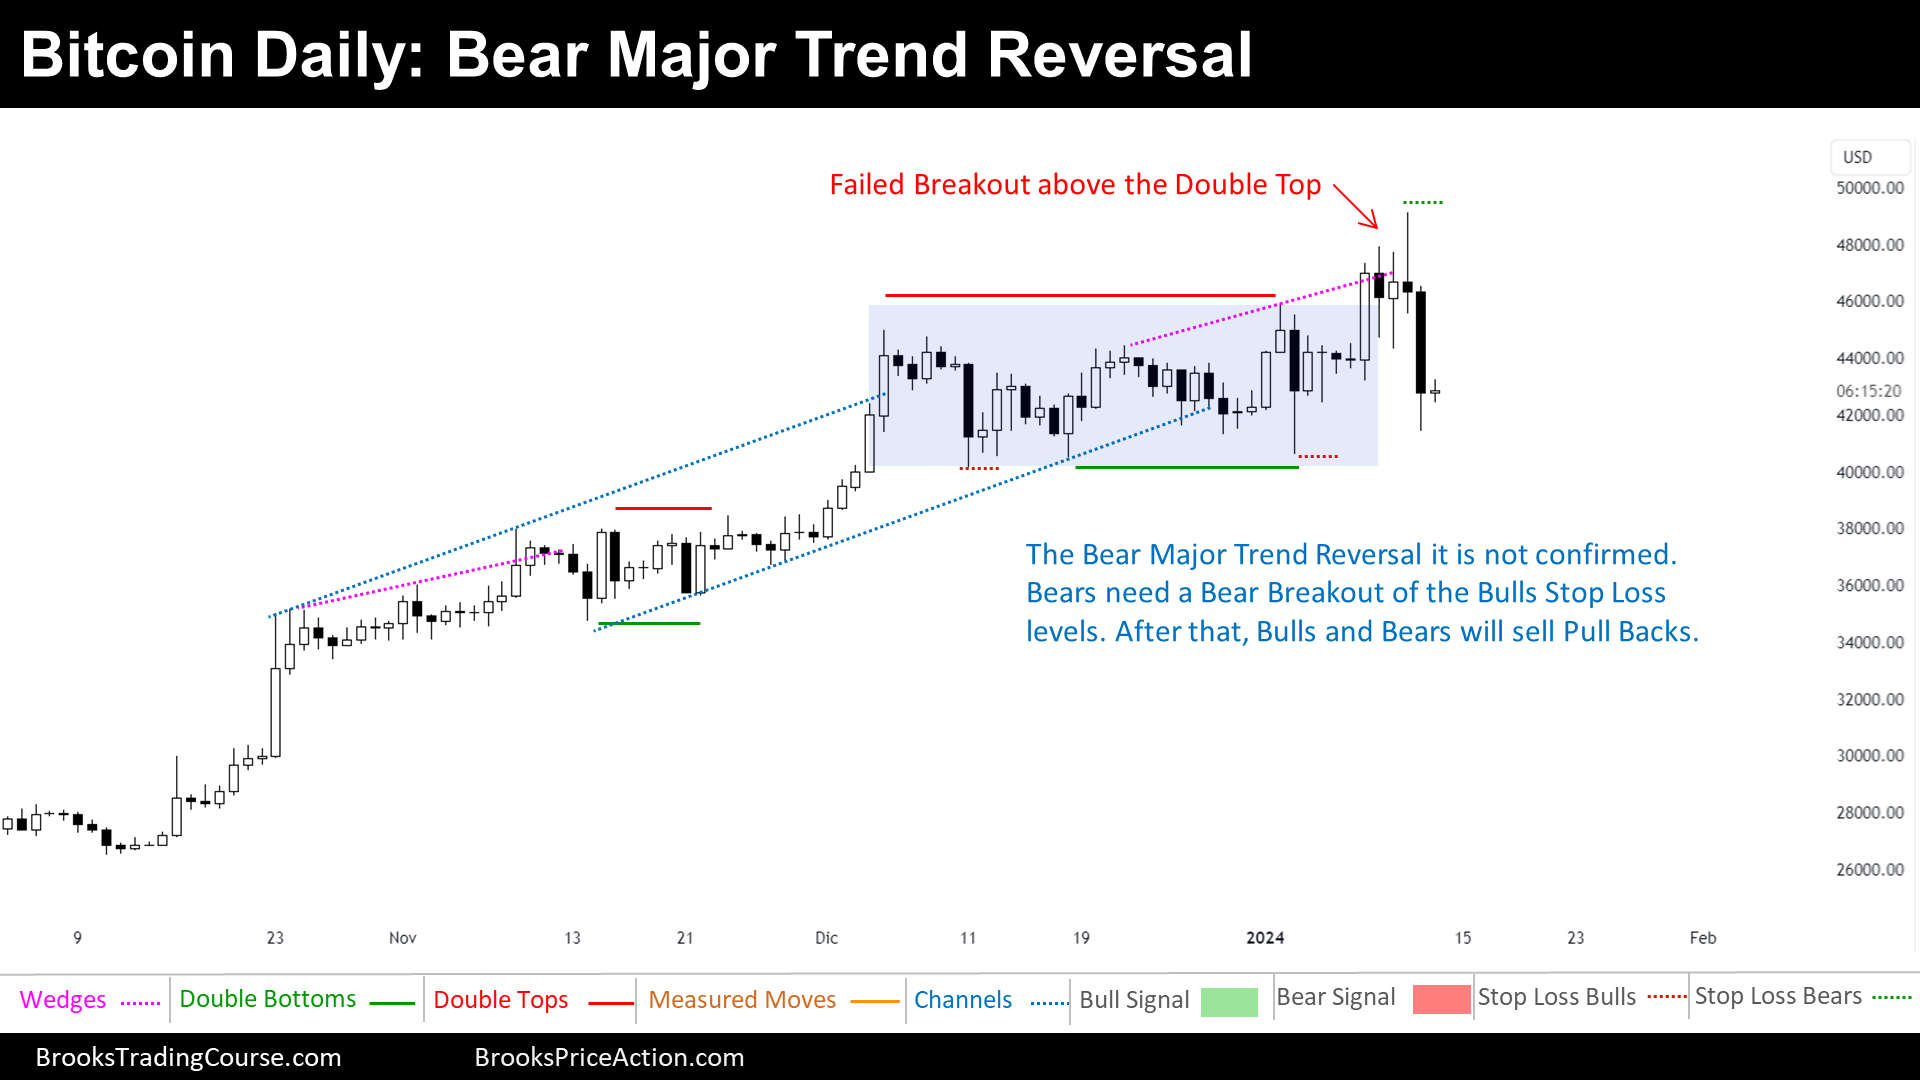
Following a complete Bull market cycle, the cryptocurrency embarked on a Trading Range phase. Within this range, traders identified support at the lower boundary and resistance at this week’s high, which it is also the 2024 high.
The ongoing market cycle bears the resemblance of a Trading Range, but there’s a palpable shift in sentiment, indications of a potential Bear Breakout and the initiation of a Bear Major Trend Reversal. Traders are left pondering whether this marks the inception of a Spike and Channel Bear Trend.
Despite the narrative, the Breakout is yet to be confirmed. Clarity will emerge if the Bears do a Bear Breakout below the Trading Range Low, where Bulls have strategically placed their Stop Losses. Until this confirmation, traders should brace for continued Trading Range dynamics. Because of the resistance on a Higher Time Frame, Bulls hesitate to buy, even amidst the possibility of another test of the 2022 High.
A speculative strategy emerges as Bears contemplate selling during a potential attempt at a new high, for example, a 50% pullback of the current Bear Leg. While a low probability sell, its compelling Risk-Reward potential makes it an enticing prospect, especially considering potential weekly targets.
Your insights and perspectives are invaluable to our community. We invite you to share your thoughts in the comments below. What are your predictions for the upcoming market movements? Your engagement enriches our collective understanding, fostering a vibrant exchange of ideas. Don’t forget to share the content if you enjoyed. Good luck and good Trading!
Josep Capo
Market analysis reports archive
You can access all the weekend reports on the Market Analysis page.

