Market Overview: Bitcoin Futures
Bitcoin futures traders are likely going to see bitcoin sideways to up, until the end of this year. The long-term view is a Trading Range between $69355 (all-time highs) and $14470 (2017 close).
Bitcoin futures
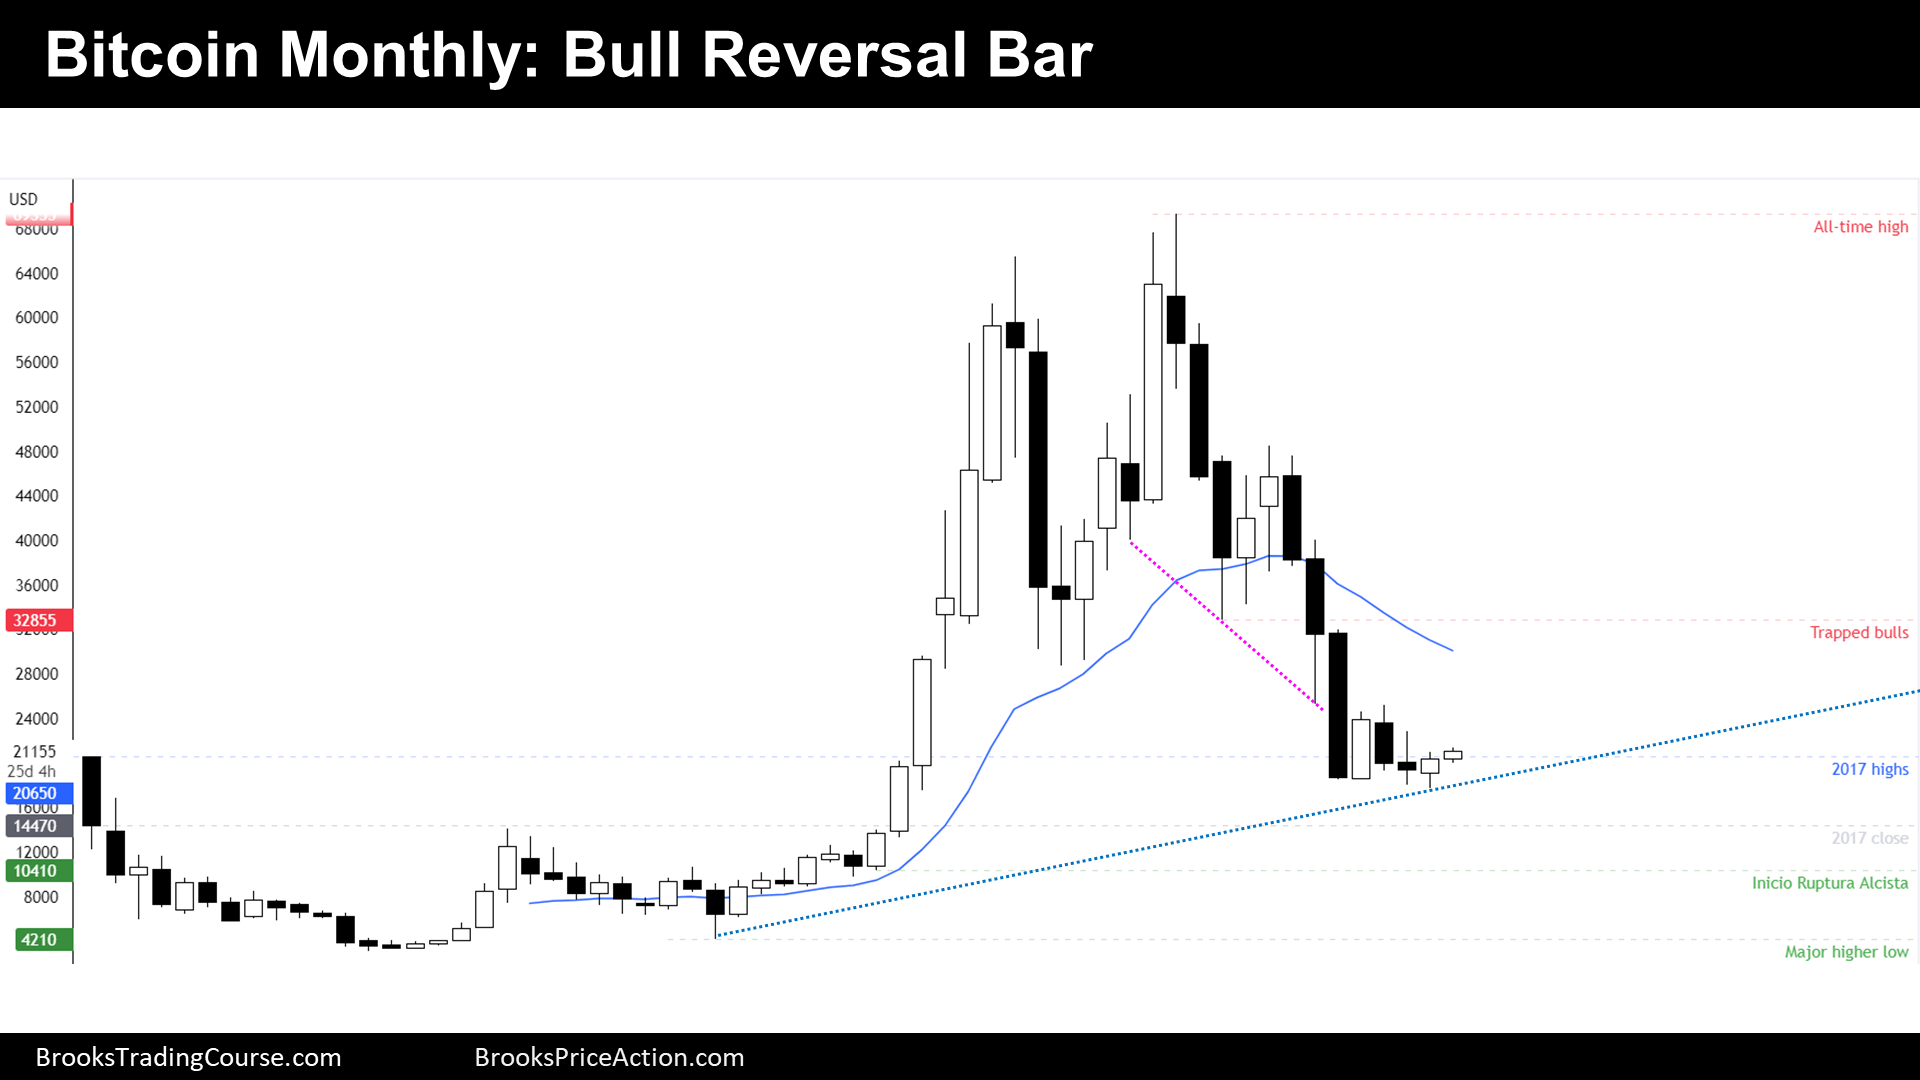
The Monthly chart of Bitcoin futures

- The past month’s candlestick is a bull reversal bar, a possible lower low major trend reversal.
- In the past monthly report, we have explained why we should expect bull pressure during October.
- We have been saying since June that the price is probably within a context of a trading range, that the bear trend, more than a trend, it is just a bear leg. In a trading range, after a bear leg, comes a bull leg.
- Is this the start of the bull leg? We don’t know yet, but we know that October is a good candidate.
- The price formed a wedge bottom that is contained within a trading range. Therefore, we should expect some kind of reversal; However, the bear leg was tight enough to suspect that the drawdown has not ended yet.
- We say that we are in a trading range, then, traders expect a test of the extremes of the trading ranges. We do not know where the bottom of the trading range is yet, but we do now that the high of the trading range is the all-time high at $69355. Is the price going to trade there soon? I do not think so. I think that the price reached that levels because of the large quantity of over leveraged participants.
- I do not foresee a similar economic environment in many years. The fair price of Bitcoin is more likely around $30000, around the 20-month exponential moving average; Hence, the price is going to draw, during the upcoming years, a triangle or a major bull flag.
- Bulls want a bull follow through bar in November. Bears want bull to fail. If bulls fail, sideways trading is more likely that a rapid move down to test the 2017 close.
- The most likely outcome, however, is higher prices during November, maybe reaching $30000 in the next 1-3 bars.
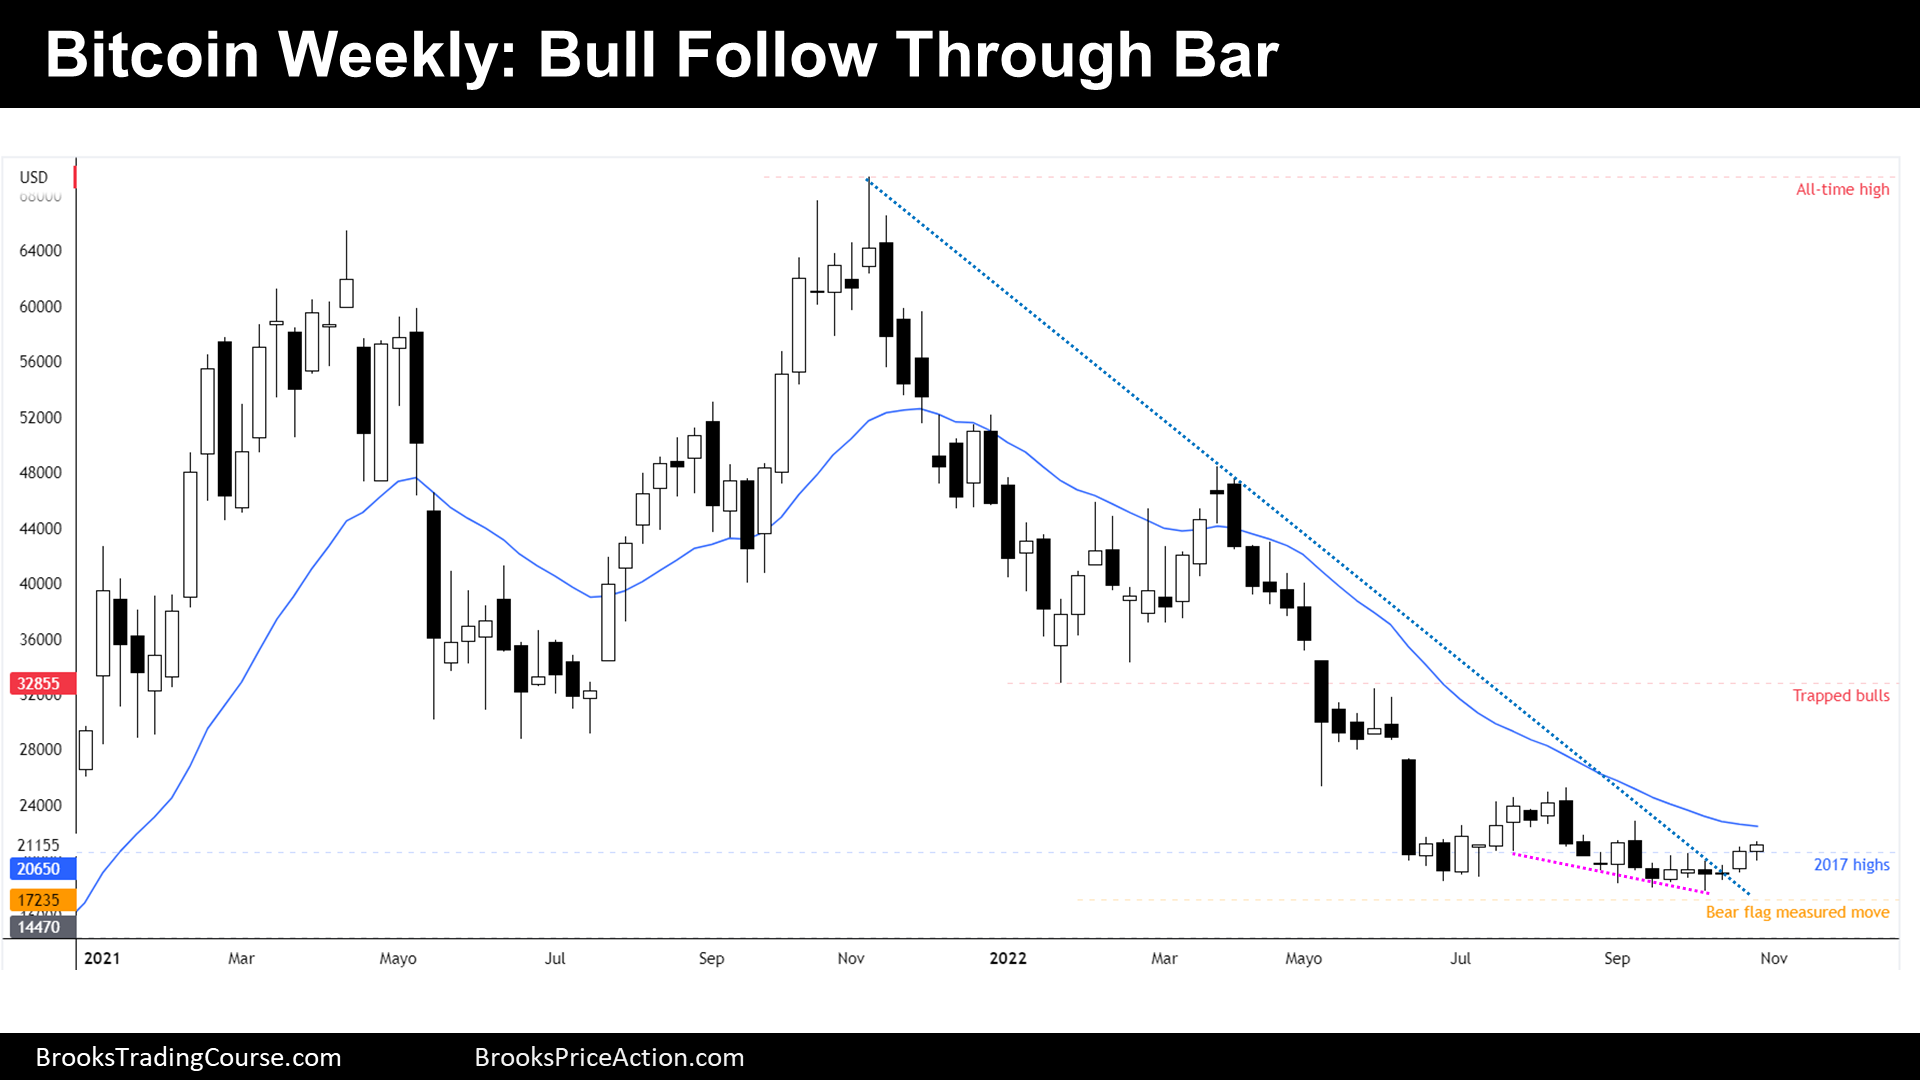
The Weekly chart of Bitcoin futures

- This past week’s candlestick was a bull follow-through bar after the prior bull signal bar.
- In the past report, we have explained why we should expect higher prices next week, which is what we got.
- The context is a tight trading range after a bear channel. The tight trading range formed a double bottom and a wedge bottom lower low, before prior’s week bull signal bar. A tight trading range after a bear channel is also a bear flag. Is this a final flag?
- Soon, we will probably see a test of the 20-week exponential moving average. If traders sell there, we are going to see a new low of the bear trend; hence, current tight trading range will be viewed as a final flag of the bear trend candidate.
- Bears and maybe bulls bought above the bull breakout bar two weeks ago. Bull’s target is the major lower high, around where trapped bulls are located. They know that if the price gets there, the bear trend will be technically over.
- Bears, of course, want a bear bar around here, which should be viewed as a double top with September or August highs.
- Because bulls got good follow though, we should expect the price to rise during the upcoming weeks.
Market analysis reports archive
You can access all weekend reports on the Market Analysis page.

