Market Overview: Bitcoin Futures
The Bitcoin futures traded above last week’s high, and then it reversed down, with Bitcoin bull reversal failing. Traders are confused because the price is at support and resistance simultaneously. Bears targets are at an 80% drawdown from the all-time highs.
Bitcoin futures
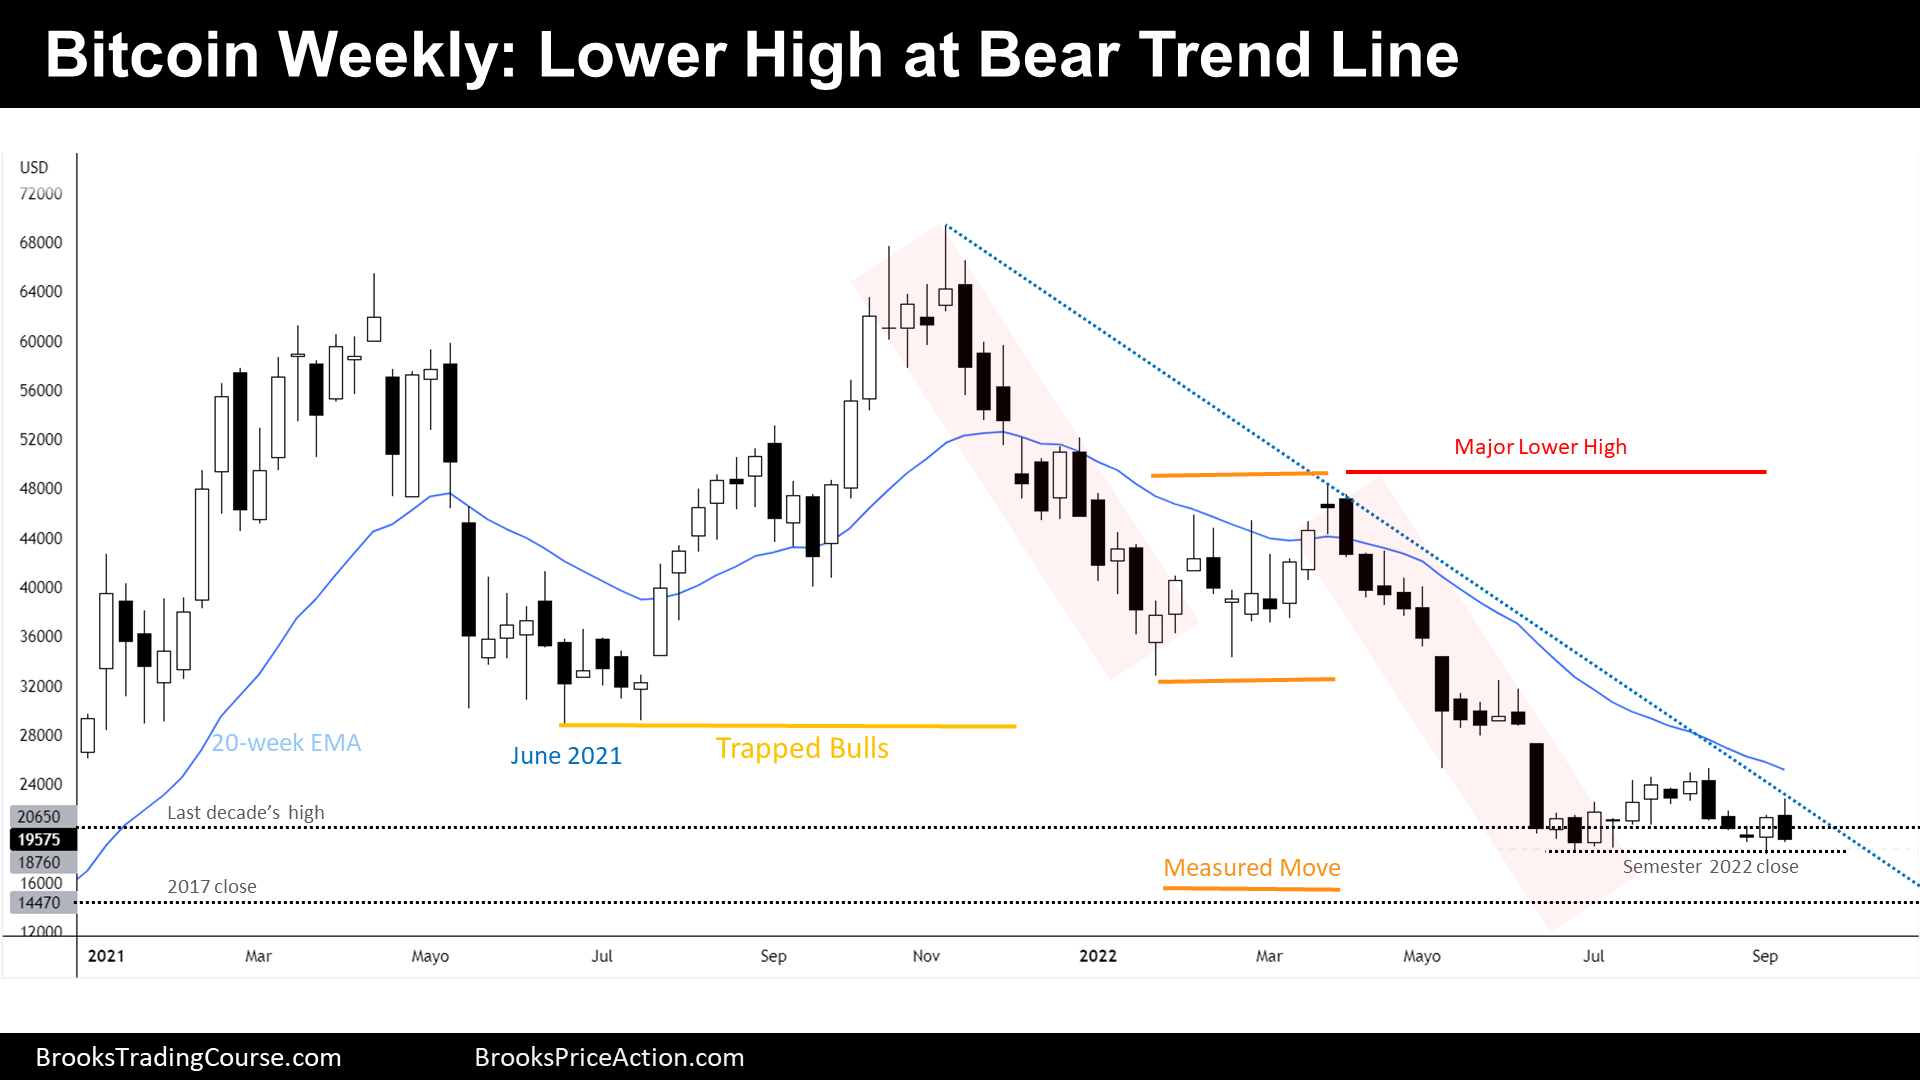
The Weekly chart of Bitcoin futures

- This week’s Bitcoin futures candlestick is a bear reversal bar closing on its low. It is a sell signal bar for next week. It is also a bear sell setup, a lower high stalling at the top of a major bear trend line.
- During the prior report, we have said that the chances were that the bulls would get good follow through, but this was not the case. Bulls failed. It is the second time that bulls failed a reversal coming up from the 2022 semester close.
- Last week, we have said that the bears failed twice to trade below the semester close.
- Bears failed twice, bulls failed twice. Traders are confused.
- Because the gap between June 2021 low and July 2022 high is open, the bears have greater odds, and they might continue to trend down.
- But as anyone can observe, the odds are well-balanced between participants. The proof is that we can build strong arguments for either bulls or bears.
- Bulls think that we are forming a double bottom at support (last decade’s high) and that we are at a buy zone on higher timeframes, or that the buy zone is not far below.
- More important, reminder of the structure of the trading scene:
- Bears have more probability of trading down than the bulls. But their profit targets are not far below, and therefore their risk is big. They should be trading small.
- Bulls have low probability of success, but their risk is low because they know that bears will buy not far below.
- Because this week is a good sell signal bar within a good bear setup, if we trigger the signal by trading below this week’s low, we will probably see new lows of the year. We can even see the price quickly reach critical bear targets (prior bear flag measured move and 2017’s close) at around an 80% drawdown from the all-time highs.
- The price might not trigger the bearish signal bar because if bitcoin is within a tight trading range, traders will buy bear closes and sell bull closes. Or maybe it triggers the sell signal, and then it reverses up; that could mean that price it is forming the bottom of a major trading range.
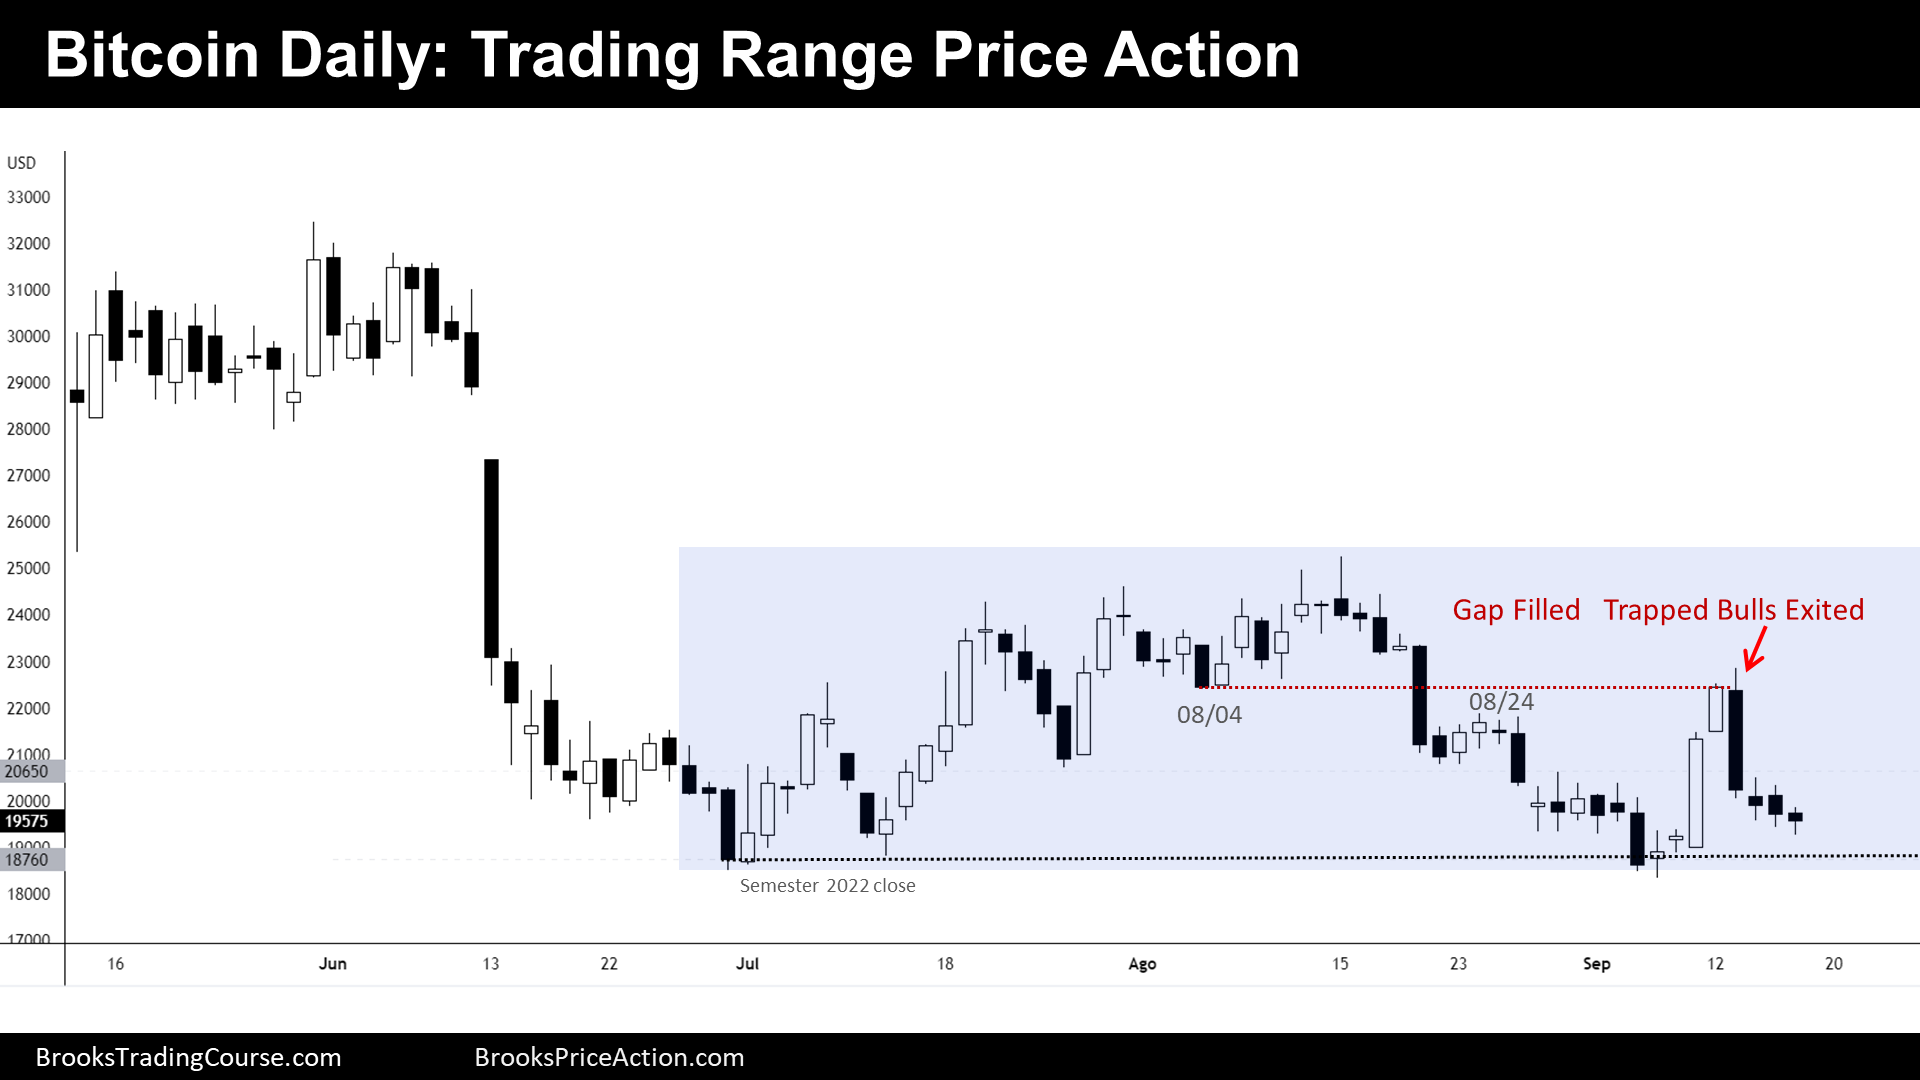
The Daily chart of Bitcoin futures

- Last week we have said that we would likely trade higher and reach the 08/04 low, and this is what happened.
- Then, the price reversed down sharply instead of continuing up a measuring gap, which was expected after the good follow-through bar on Monday. But as stated, the price reversed down sharply.
- There were sellers at the 08/04 low, but those sellers were trapped bulls. Trapped bulls that bought reasonably that low, because at that moment the price was contained within a bull channel. There were a lot of trapped bulls apparently, and fortunately for them, they exited without a loss.
- The selloff was not originated by the bears, and this is important to note.
- The best the traders can do, for now, is being aware that the market cycle is more likely a Trading Range. Traders should look to buy a reversal up from the bottom third of the range, or sell at around the top third of the range.
- Bulls see that the last three candlesticks had prominent tails. They think that there should be a bull reversal soon. Therefore, bulls will try to buy above a bull bar.
- But the bears see 4 consecutive bear bars near the bottom of the range, that is bear momentum. They are paying close attention to the opportunity that could bring to them a bear breakout of the trading range.
- When we look at a chart, and there is a lack of directionality, we should expect reversals. That approach will work on the long term.
Market analysis reports archive
You can access all weekend reports on the Market Analysis page.

