Monthly S&P500 Emini futures candlestick chart:
Pullback for 2nd month
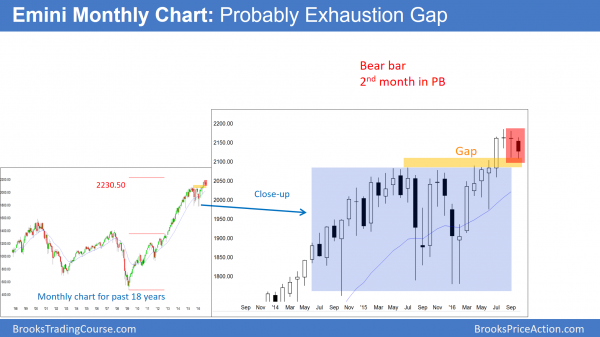
The monthly S&P500 Emini futures candlestick chart traded below last month’s low and therefore has pulled back for 2 months. While the bears see August as a Low 2 sell signal bar, it was a doji. It was therefore a low probability sell. This is especially true after 7 consecutive bull trend bars.
The monthly S&P500 Emini futures candlestick chart is still in a bull trend, but the trend is climactic. Yet, the 2 year trading range will probably be the Final Bull Flag. As a result, the current bull breakout will probably be unable to go far before the Emini reverses back down into the 2 year range.
A trading range is a magnet. Because the breakout has not gone far, the Emini is still being held back by the magnetism of the trading range. While the bulls can create a much stronger breakout and move up for a measured move, they have given no sign that they are about to do that. Therefore, it is more likely that the Emini returns to the trading range than continues much higher.
Because the rally since July is in a tight channel and there have been 2 legs up, traders will probably sell a rally to a new high. They would do so because they know that a reversal down would create a Parabolic Wedge top above a likely Final Flag. There would be a 60% chance of at least a couple small legs down after a reversal.
Exhaustion Gap or Measuring Gap?
Last month was the entry bar for the bears, yet it was also a doji bar. Hence, it was another sign that the bears are not yet strong. While this month is the 2nd month of the pullback, it is not yet a big bear trend bar. The bears need to do more to close the gap above the July 2015 high of 2084.50. Because that gap formed late in a bull trend, the odds are that it is an Exhaustion Gap rather than a Measuring Gap. As a result, the Emini will probably close it before it can go much above the all-time high.
Weekly S&P500 Emini futures candlestick chart:
Break below ii lower high
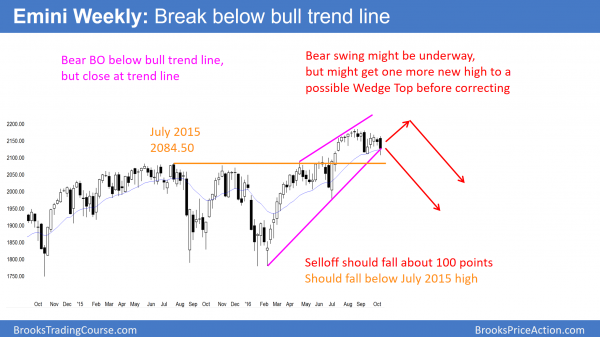
The weekly S&P500 Emini futures candlestick chart broke below the ii pattern of the past 2 weeks and bull trend line, yet closed back around the breakout point.
The weekly S&P500 Emini futures candlestick chart has had 2 strong legs up from the February low. As a result, traders will look to sell a reversal down from a new high. They would see the entire rally as a wedge higher high major trend reversal after the 2 year trading range. Furthermore, they would see September as the Final Bull Flag.
Because the breakout above the 2 year trading range did not go far, the reversal down might have already begun. Yet, without one or two big bear bars closing on their lows, most traders believe that a continued trading range is more likely than a breakout up or down.
High 2 bull flag
While the bears are looking for a climactic top, the bulls see the past month as a High 2 buy setup. They bought below the September low, expecting a failed breakout and a lower low double bottom. While they might be right, they need to do more. Because this week had a bear body, it is a low probability buy signal bar. Yet, if the bulls can create a bull bar next week, traders will be more interested in buying above its high. This is especially true if next week is a bull bar closing on its high.
Daily S&P500 Emini futures candlestick chart:
Weak October stock market rally and risk of sharp selloff
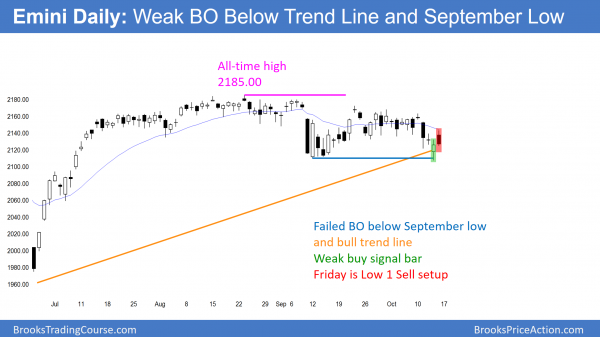
The daily S&P500 Emini futures candlestick chart reversed up Thursday after breaking below the bottom of the 2 month trading range. Yet, the reversal bar had a big tail and Friday was a weak entry bar.
The daily S&P500 Emini futures candlestick chart pulled back from a breakout below the September low and the bull trend line. The bulls want the reversal up to be the end of the 2 month pullback. Yet, without a strong buy signal bar or entry bar, the odds are that it will go sideways for at least a couple more days. If it then falls below this week’s low, the September support would fail. As a result, there could be a fast measured move down.
Bear flag or failed bear breakout?
The bears see the weak reversal up and believe it is just a brief pullback from the breakout below the September low. Yet, the pullback had a reasonably strong bull body on Thursday. This increases the chances of a few more sideways bars. As a result, the Emini might create a Low 2 bear flag next week.
If it does, the bears will sell the bear breakout below the flag or below this week’s low. The bulls will buy below the Low 2 sell signal bat. This is because they believe that the bears will fail. They then want a bull breakout above the bear flag, and then a measured move up.
In conclusion, because the bears did not create a strong breakout and the bulls did not create a strong reversal up, the odds are that the Emini will go sideways for at least a couple more days.
Risk of brief big bear breakout
I wrote a couple of week’s ago about a subtle, but important pattern that is unfolding on the daily chart. If you scroll to the bottom of that weekly update, you will see an example on a 5 minute chart. The daily chart had a double top in a tight trading range. The September selloff might be just the 1st of 2 legs down. If so, the 2nd leg can be shockingly big and fast.
Therefore, this means that there is a 40% chance of a 50 – 100 point selloff lasting 2 – 5 days starting within the next week or so. Bulls usually buy the selloff. As a result, the rally could then last to the end of the year and make a new all-time high. Since the monthly chart is probably topping out, bears will sell the new high. Hence, the overbought monthly chart might begin a sideways to down correction that could last for a couple of years.
Traders can see the end of the day bar-by-bar price action report by signing up for free at BrooksPriceAction.com. I talk about the detailed Emini price action real-time throughout the day in the BrooksPriceAction.com trading room. We offer a 2 day free trial.
When I mention time, it is USA Pacific Standard Time (the Emini day session opens at 6:30 am PST, and closes at 1:15 pm PST). You can read background information on the intraday market reports on the Intraday Market Update page.


