Monthly S&P500 Emini futures candlestick chart:
Strong bull breakout, but possible exhaustion gap
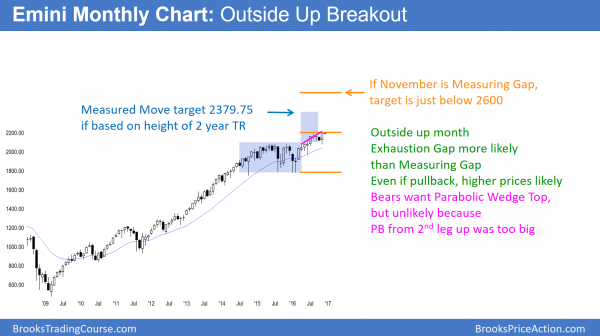
The monthly S&P500 Emini futures candlestick chart formed a big outside up month in November. It closed at a new all-time monthly high. Because of the 3 pushes up from February, bears will try to create a reversal down from a parabolic wedge top.
The monthly S&P500 Emini futures candlestick chart had a big outside up bar in November. It closed at a new all-time monthly high, and therefore is a sign of strong bulls. Yet, it was the 3rd push up in a tight channel since February. Hence, the bears will try to create a parabolic wedge top reversal this month or next.
The bulls instead want a measuring gap. They therefore want any pullback in December to stay above the August high, and especial above the October high. If the gap between the November close or the December low closes, then November has an increased chance of being an exhaustion gap. That would therefore increase the chance of a reversal down.
Because the 11 month rally has been strong, the bears will a strong sell signal bar before traders will short. If December closes on its low, it would be a sell signal bar for a parabolic wedge top. Furthermore, the 2 year trading range might be the Final Bull Flag in the 7 year bull trend. Even if the bears get their sell setup, the probability of the reversal down would only be 40%. More likely, the reversal would be minor. Therefore several sideways months would be more likely than a reversal down.
Weekly S&P500 Emini futures candlestick chart:
Wedge top and failed breakout
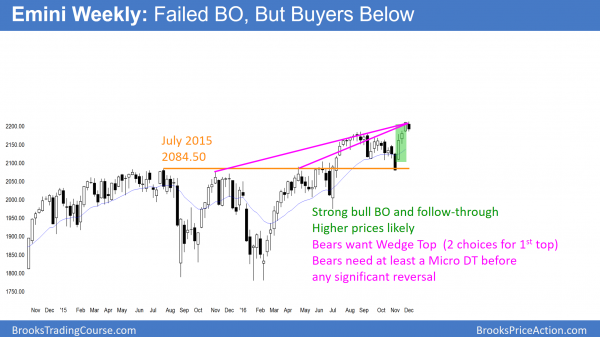
The weekly S&P500 Emini futures candlestick chart formed a bear bar this week after a 3 week bull breakout. While this is a possible top, the 3 bull bars were strong enough to make a pullback and bull flag more likely than a reversal.
The weekly S&P500 Emini futures candlestick chart formed a bear bar closing on its low this week. Because this followed 3 big bull trend bars, the odds are that there are buyers below. Yet, the bears see it as a sell signal bar in a wedge top. Some computers see November 6, 2015 as the 1st push up. Others see April 22 as the 1st leg up in the wedge.
Because the last leg up was strong, the odds are that there are buyers below this week’s low. Furthermore, the bears will probably need at least a micro double top before they can reverse the bull trend. That means the downside risk is small for at least a couple of weeks.
While it is possible for this to be the top without a micro double top, the bears would probably need 3 or more consecutive bear bars to convince traders that they have taken control. The probability still favors the bulls. A pullback into a bull flag is therefore more likely than a reversal into a bear trend.
Daily S&P500 Emini futures candlestick chart:
Trump rally pausing before Fed FOMC interest rate hike
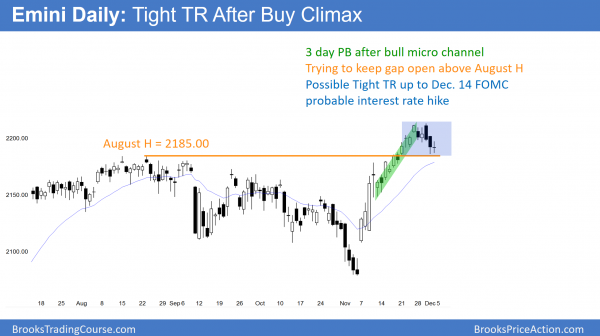
The daily S&P500 Emini futures candlestick chart sold off for several days after a new all-time high. Yet, the selloff is more likely to be minor. Therefore a trading range is more likely than a bear trend.
The daily S&P500 Emini futures candlestick chart pulled back for 3 days after a new all-time high. I said last week that the bulls had a 12 bar bull micro channel. That was therefore unsustainable and climactic. Yet, it is also a sign of strong bulls. As a result, bulls bought the 1st pullback.
Furthermore, I said that the pullback usually leads to a brief new high. The bulls got that on Wednesday. Finally, I said that the Emini then often goes sideways for about 10 days. That means that the Emini might stay mostly sideways until the December 14 FOMC meeting.
While the Fed is likely to raise interest rates, which is bearish, the institutions have already factored that into the current price. Therefore, wherever the Emini is at the time of the announcement, the probability of a rally or a selloff will be 50%.
Traders can see the end of the day bar-by-bar price action report by signing up for free at BrooksPriceAction.com. I talk about the detailed Emini price action real-time throughout the day in the BrooksPriceAction.com trading room. We offer a 2 day free trial.
When I mention time, it is USA Pacific Standard Time (the Emini day session opens at 6:30 am PST, and closes at 1:15 pm PST). You can read background information on the intraday market reports on the Intraday Market Update page.


