Monthly S&P500 Emini futures candlestick chart:
Strong bull trend, testing top of bull channel
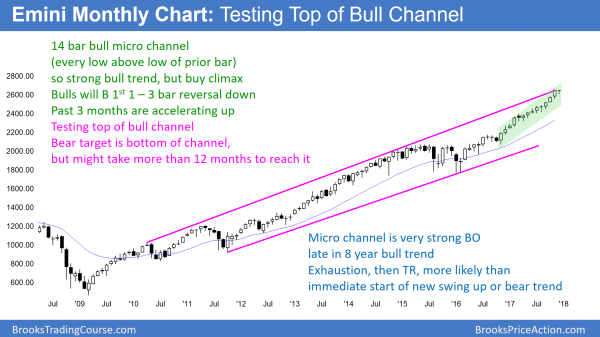
The monthly S&P500 Emini futures candlestick chart had its 3rd consecutive big bull trend bar in November. Furthermore, it has gone 12 months without falling below the low of the prior month. This is therefore a 13 bar bull micro channel. Since it is a sign of very strong bulls, the bulls will buy the 1st 1 – 3 bar pullback. Finally, the rally is just below the top of a 9 year bull channel.
The monthly S&P500 Emini futures candlestick chart’s rally is unusually strong and therefore unsustainable and climactic. However, strong bull trends only rarely become bear trends without going sideways for at least a few bars. Therefore the downside risk over the next several months is small. The best the bears can probably get is a pullback for a few months.
Since the rally is climactic, there is an increased risk of a reversal after the bull trend resumes up from its 1st pullback. For example, if it forms a micro double top, it could pull back for 6 months or more. Yet, without going sideways for 5 – 10 bars, the odds of a bear trend are small. Consequently, the best the bears can probably get over the nest 6 – 12 months is a trading range. Even if they get a 20% selloff, it will probably only be a bear leg in a trading range.
Top of a 9 year bull channel
This rally is testing the top of a 9 year channel. While most channel breakout attempts fail, the momentum up has been exceptional. Consequently, if the bulls fail to break above the top of the channel, the odds are that they will need many bear bars before the bears can get a reversal down. Since this is a monthly chart, the odds are that the best the bears can get over the next 6 months is a fairly tight trading range. There is only a 25% chance that a reversal down in the next several months would begin a bear trend.
Weekly S&P500 Emini futures candlestick chart:
Trump rally continuing before tax reform vote and budget resolution
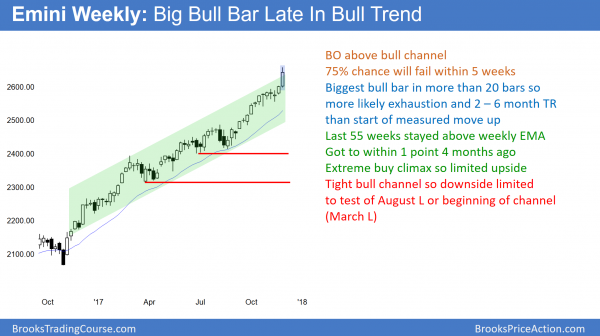
The weekly S&P500 Emini futures candlestick chart is breaking above a yearlong tight bull channel. However, it has not touched the 20 week exponential moving average in 55 weeks, which is unusual and therefore climactic.
The weekly S&P500 Emini futures candlestick chart is continuing in a climactic bull trend. There is no sign of a top. In addition, the yearlong bull channel is tight. That is a sign of very strong bulls. As a result, the bulls will probably buy the 1st reversal down, even if it is more than 5%. Consequently, the risk of a bear trend within the next few months is small. More likely, the best the bears can probably get is a trading range. This means that the 1st reversal will likely be a bull flag lasting a few weeks to a couple months.
No touch of the 20 week exponential moving average in more than a year!
The weekly chart has held above its 20 week EMA for 55 weeks. The streak is now more than a year. This has happened only one other time in the history of the S&P500 cash index. That was in 1995 when it stayed above for 62 weeks. The Emini then pulled back 4.6% before the bull trend resumed. The stock market tripled in value over the next 5 years.
The current streak is already exceptional. Most streaks end around 20 weeks. However, there is no sign of a top. Furthermore, the 20 week EMA is so far below that any reversal would probably take several weeks to get there. This means that the streak will continue for at least a few more weeks.
When the Emini finally reaches it average weekly price, the bulls will be eager to buy. This is because they have been paying an above average price for a year. They will see the average price as a brief discount. When there is a pullback, it may fall 20 or more points below the average before the bull trend resumes. The chance of a reversal into a bear trend on the 1st time down is small.
Daily S&P500 Emini futures candlestick chart:
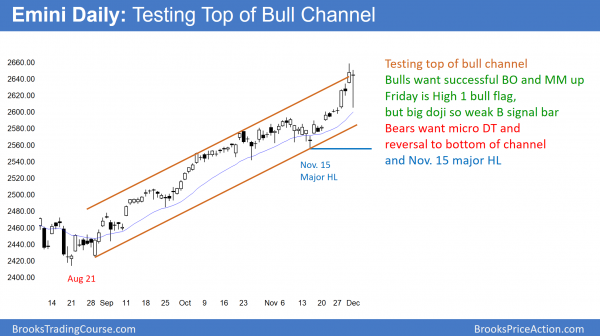
Sharp pullback on Friday, but became buy signal bar
The daily S&P500 Emini futures candlestick chart sold off on Friday, but reversed up strongly. Friday is therefore a High 1 buy signal bar for Monday. Since it is a doji bar, it is a low probability buy signal and the odds favor sideways soon.
The daily S&P500 Emini futures candlestick chart has not had a 3% correction in 261 trading days and 395 calendar days. This is the longest streak in the history of the stock market. However, there is no sign that it is about to end. A 3% correction is about 80 points. That would probably require at least 3 days. Consequently, the streak will probably last at least 3 more days. As strong as Friday’s early selloff was, it was only about 2%.
Because strong rallies only rarely reverse into strong selloffs, the bears will probably need at least a small trading range before a 3% correction begins. Therefore, the streak will likely last at least another week or two, and possibly many more weeks.
The 3 week rally has lacked consecutive big bull trend bars. It is therefore not as strong as the other breakouts since March. However, it is strong enough so that the bears will need at least a micro double top before they can create a strong reversal down. Therefore, the best they probably can get over the next week is a pullback.
Traders can see the end of the day bar-by-bar price action report by signing up for free at BrooksPriceAction.com. I talk about the detailed Emini price action real-time throughout the day in the BrooksPriceAction.com trading room. We offer a 2 day free trial.
When I mention time, it is USA Pacific Standard Time (the Emini day session opens at 6:30 am PST, and closes at 1:15 pm PST). You can read background information on the intraday market reports on the Intraday Market Update page.


