Monthly S&P500 Emini futures candlestick chart:
Failed bull breakout
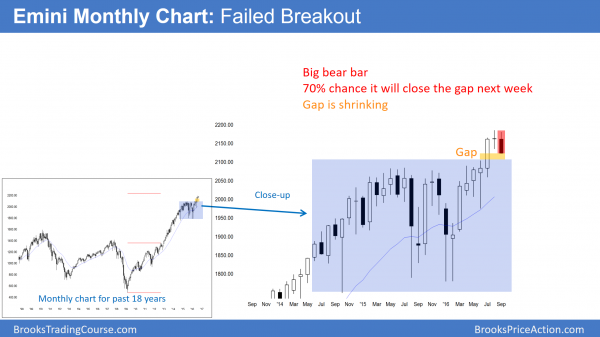
The monthly S&P500 Emini futures candlestick chart has a bear body. It will probably have a bear body when the month closes because the rally has been climactic.
The monthly S&P500 Emini futures candlestick chart had 7 consecutive bull trend bars as of last month. That is rare. Therefore, an 8th is even more rare. Hence, the odds are that September will have a bear body, which means a close below its open.
Buy climax
The Emini formed a big bull trend bar in July. It broke far above the 2 year trading range. Therefore, there is a big gap between its close and the top of the 2 year trading range. Furthermore, there is a gap between the lows of August and September and the top of that range. Yet, that gap shrunk Friday because of the strong reversal down. The gap will probably close next week.
When a gap forms after 20 bars in a trend, it is more likely an exhaustive end of the trend than the start of a new leg up. Weak bulls who have been waiting to buy can wait no longer. They buy the big bull bar, thinking that they finally have to buy what is clearly a strong bull trend. Weak bears keep selling the rally. They thought it could not last long, but finally cannot take the stress any longer. They therefore buy back their shorts. The result of this desperate buying by traders willing to buy at any price is a big bull trend bar that has no one left wanting to buy.
What do strong bulls and bears do after a buy climax?
Strong bulls see the big bull breakout as a gift. They use it to take profits, and then wait for a pullback before buying again. Strong bears see it as a great chance to sell at a very high price. They are selling because they believe that the top is near. These bears are strong because they can withstand the pressure of a continued rally. They use it to sell even more. These bears are never planning to buy back their shorts until after they get their bear trend.
Realistically, if the rally continues for many months, even the strong bears will buy back their shorts for a loss. However, many see this rally as a climactic end of a 7 year bull trend. They will only exit if the Emini continues much above the 2400 measured move target (based on the height of the 2 year trading range).
Sell entry bar?
If the bears get their bear trend bar this month, September would then be a strong sell entry bar for a failed breakout above a 2 year trading range. A trading range late in a bull trend is usually the Final Bull Flag. While that is likely here, the 7 month bull breakout is not just a climax. It is also a sign of strong bulls.
Therefore, the reversal down will probably be brief. As a result of this bull momentum, the odds are that the bulls will buy the selloff. This would then create a 2nd leg up. Because of the Final Flag, the rally might not last long. The bears will try to create a double top or lower high, and then a TBTL Ten Bar, Two Leg reversal down over the next year.
1500 within 3 years
While there is a 60% chance of a drop to the 1500 area over the next few years, the current bull trend has a 40% chance of reaching the 2400 measured move target, based on the height of the 2 year trading range. I have talked about the 1500 target many times over the past year. The 2000 and 2007 highs formed a double top on the monthly chart. Yet, the bulls got a breakout above the double top. However, the market never tested the breakout point. Since the Emini usually comes back to breakout points, the odds are that the Emini will test 1500 before going much higher.
Pullback more likely than bear trend
While it is possible that this reversal is the start of the move down to 1500, it is more likely going to be a pullback on the monthly chart. The momentum up in July was strong. Therefore, bulls will probably see a 5% pullback here as a chance to buy stocks on sale.
The bears need to do much more before they can convince traders that this is a bear trend. Even if they are able to take the market down to the 1800 bottom of the 2 year trading range, there would probably be a bounce. Bears would take profits and bulls would buy. This would result in a rally. Yet, many traders would sell that rally, betting on either a trading range or a lower high major trend reversal (Head and Shoulders Top).
This top would probably require 10 – 20 bars. It therefore would take place over at least a year or two. While a reversal down from a Final Flag can be shockingly violent and relentless, the selloff usually finds support at the bottom of the final flag. Therefore, a Head and Shoulders Top is more likely than a collapse.
Weekly S&P500 Emini futures candlestick chart:
Outside down reversal
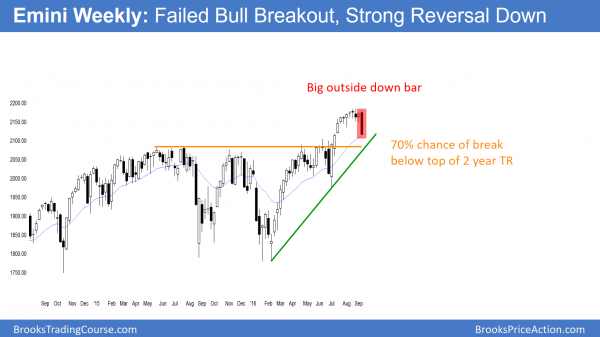
The weekly S&P500 Emini futures candlestick chart this week traded above last week’s high and then below last week’s low. This means that this week was an outside down week, which is a sign of strong bears. The minimum targets are the bull trend line, the moving average, and a test to just below the top of the 2 year trading range.
The weekly S&P500 Emini futures candlestick chart had an outside down bar in a bull trend, and hence created a sign of strong bears. Because it formed late in a bull trend and after a potential Final Bull Flag, it has more significance. It increases the chances that the reversal attempt will be successful.
Whenever there is an outside down bar in a bull trend, traders have to be ready for a bull inside bar. This is an ioi buy setup. While the context for lower prices is good, traders can never ignore the opposite of what they believe because the opposite usually happens at least 40% of the time.
Daily S&P500 Emini futures candlestick chart:
Bear trend reversal, but September stock market crash is unlikely
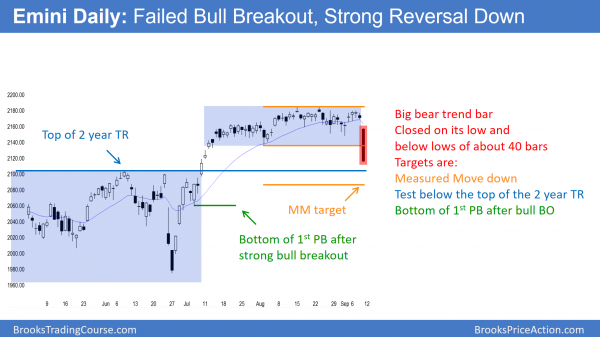
The daily S&P500 Emini futures candlestick chart formed a big bear trend bar on Friday and it closed below the August and September tight trend range.
The daily S&P500 Emini futures candlestick chart had a tight trading range in August and a lower one in July. Friday formed a big bear trend bar and it closed below the both trading ranges. It therefore closed below the lows of about 40 bars. Furthermore, it closed on its low. These are signs of strong bears.
Because it was a big bear trend bar at the end of a bull trend, it is a “give up” bar. Hence, it tells traders that a lot of bulls are finally giving up. It therefore increases the chances of lower prices over the next week or two.
It is also a possible start of a bear trend on the daily chart. The first target is the top of the 2 year trading range. Some computers see that as the 2104.25 June high. More see it as the 2084.50 July 2015 high.
Since the rally from the July low was a Spike and Channel bull trend, the bottom of the 1st pullback after the bull breakout is a target. That is the July 6 low of 2059.25. In any case, if Friday is the start of the correction, the minimum objective is a closure of the gap on the monthly chart, which means a drop below the 2084.50 July 2015 high. There is also a bull trend line in that area.
The importance of next week
Whenever there is a big bear breakout bar, traders pay special attention to the next bar. If it is also a big bear trend bar closing on its low, it increases the chances of some kind of measured move down. The minimum that the bears want to see is the absence of a bull body on Monday. Therefore, if Monday is a bull bar, traders will wonder if the bear breakout will fail. Many will buy a reversal up.
With this week’s bear bar as big as it was, and with it closing below the lows of so many bars, the odds are that there will be at least one more leg down. This is true even if Monday has a bull body, and even if there is a rally for a few days. The bulls would need a strong bull reversal next week to convince traders that this week is just a 2 legged pullback from the August high (where September 1 was the 1st leg down).
Greater Fools Theory and a crowded trade
I have written many times over the past month that many of the buyers in July and August were momentum bulls. Hence, they were buying because the Emini was going up, not because they thought the Emini was cheap. They are therefore “greater fool theory” bulls, betting that there will be a bigger fool who will buy from them at a higher price so that they can make a profit.
Once the momentum stops or there is a minor reversal, these bulls exit quickly. This is called a “crowded” trade, which means too many traders buying high. As a result of their eagerness to get out on a minor selloff, the reversal down can be fast and quickly fall for 5% or more.
Traders can see the end of the day bar-by-bar price action report by signing up for free at BrooksPriceAction.com. I talk about the detailed Emini price action real-time throughout the day in the BrooksPriceAction.com trading room. We offer a 2 day free trial.
When I mention time, it is USA Pacific Standard Time (the Emini day session opens at 6:30 am PST, and closes at 1:15 pm PST). You can read background information on the intraday market reports on the Intraday Market Update page.


